India's Largest Metals Refinery Just Ran Out Of Silver For The First Time In History
India's Largest Metals Refinery Just Ran Out Of Silver For The First Time In History
Shortages hit London too. The silver market is broken.
 Sold Out in India, Panic in London
Bloomberg comments https://www.bloomberg.com/news/articles/2025-10-18/sold-out-in-india-panic-in-london-how-the-silver-market-broke
Key Takeaways
Vipin Raina’s company, India’s largest precious metals refinery, ran out of silver stock for the first time in its history due to high demand from Indian customers.
The shortages in India were soon felt globally, with the London silver market also running out of available metal, and traders describing a market that was “all but broken”.
The silver market crisis was caused by a combination of factors, including a multi-year solar power boom, a rush to ship metal to the US to beat possible tariffs, and a sudden spike in demand from India, particularly during the Diwali holiday season.
For months, Vipin Raina had been bracing for a stampede of buying from Indian customers loading up on silver to honor the Hindu goddess of wealth.
Sold Out in India, Panic in London
Bloomberg comments https://www.bloomberg.com/news/articles/2025-10-18/sold-out-in-india-panic-in-london-how-the-silver-market-broke
Key Takeaways
Vipin Raina’s company, India’s largest precious metals refinery, ran out of silver stock for the first time in its history due to high demand from Indian customers.
The shortages in India were soon felt globally, with the London silver market also running out of available metal, and traders describing a market that was “all but broken”.
The silver market crisis was caused by a combination of factors, including a multi-year solar power boom, a rush to ship metal to the US to beat possible tariffs, and a sudden spike in demand from India, particularly during the Diwali holiday season.
For months, Vipin Raina had been bracing for a stampede of buying from Indian customers loading up on silver to honor the Hindu goddess of wealth.
 But when it came, he was still blown away. At the start of last week, his company, India’s largest precious metals refinery, ran out of silver stock for the first time in its history.
“Most people who are dealing silver and silver coins, they’re literally out of stock because silver is not there,” said Raina, who is head of trading at MMTC-Pamp India Pvt.
“This kind of crazy market — where people are buying at these levels — I have not seen in my 27-year career.”
Within days, the shortages were being felt not just in India, but around the world. India’s festival buyers were joined by international investors and hedge funds piling into precious metals as a bet on the fragility of the US dollar — or simply to follow the market’s irrepressible surge higher.
By the end of last week, the frenzy had rippled across to the London silver market, where global prices are set and where the world’s biggest banks buy and sell in huge quantities. Now, it had run out of available metal. Traders describe a market that was all but broken, where even large banks stepped back from quoting prices as they fielded repeated calls from clients yelling down the line in frustration and exhaustion.
This account of how the silver market broke is based on conversations with more than two dozen traders, bankers, refiners, investors and other market participants, many of whom spoke on condition of anonymity as they weren’t authorized to speak publicly.
100-to-1 Ratio
When traders and analysts try to pinpoint the immediate cause of the silver crisis of 2025, they inevitably point to India.
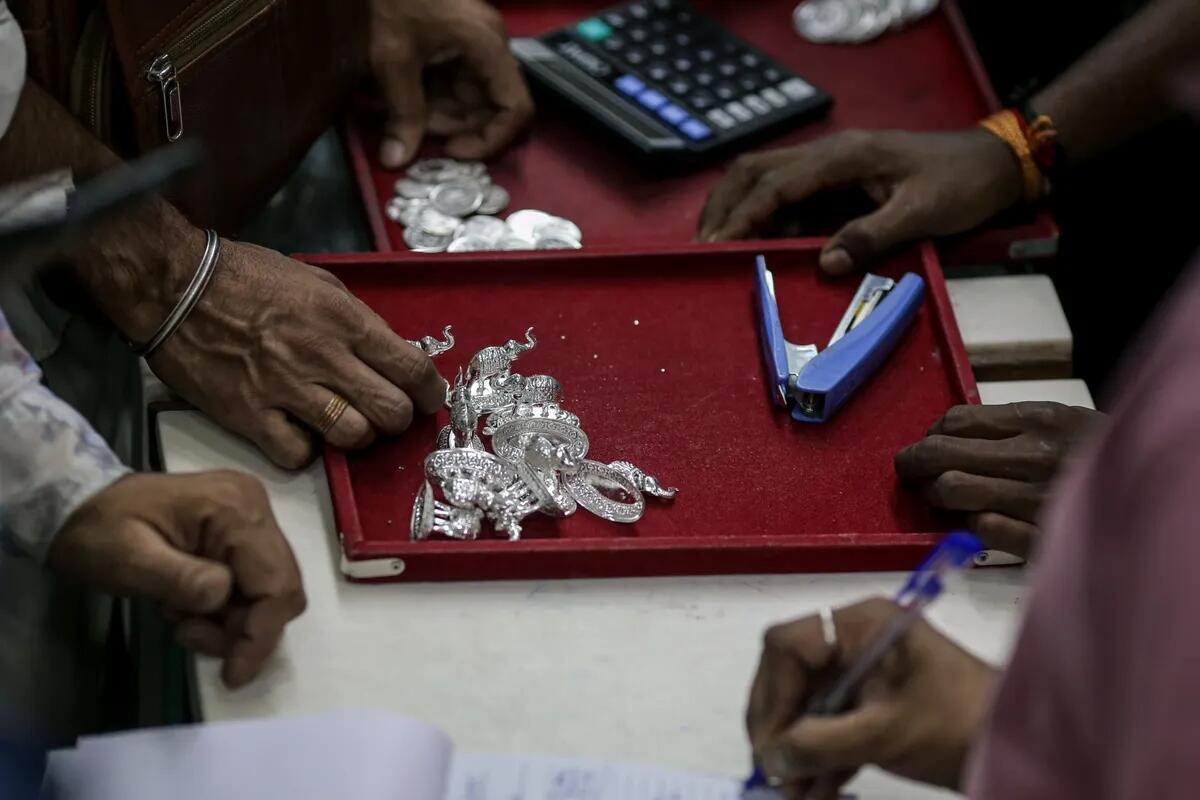
During the Diwali holiday season, hundreds of millions of devotees buy billions of rupees worth of jewelry to celebrate the goddess Lakshmi. Asia’s refineries usually meet this demand, which typically favors gold. But this year, many Indians turned to a different precious metal: silver.
But when it came, he was still blown away. At the start of last week, his company, India’s largest precious metals refinery, ran out of silver stock for the first time in its history.
“Most people who are dealing silver and silver coins, they’re literally out of stock because silver is not there,” said Raina, who is head of trading at MMTC-Pamp India Pvt.
“This kind of crazy market — where people are buying at these levels — I have not seen in my 27-year career.”
Within days, the shortages were being felt not just in India, but around the world. India’s festival buyers were joined by international investors and hedge funds piling into precious metals as a bet on the fragility of the US dollar — or simply to follow the market’s irrepressible surge higher.
By the end of last week, the frenzy had rippled across to the London silver market, where global prices are set and where the world’s biggest banks buy and sell in huge quantities. Now, it had run out of available metal. Traders describe a market that was all but broken, where even large banks stepped back from quoting prices as they fielded repeated calls from clients yelling down the line in frustration and exhaustion.
This account of how the silver market broke is based on conversations with more than two dozen traders, bankers, refiners, investors and other market participants, many of whom spoke on condition of anonymity as they weren’t authorized to speak publicly.
100-to-1 Ratio
When traders and analysts try to pinpoint the immediate cause of the silver crisis of 2025, they inevitably point to India.
During the Diwali holiday season, hundreds of millions of devotees buy billions of rupees worth of jewelry to celebrate the goddess Lakshmi. Asia’s refineries usually meet this demand, which typically favors gold. But this year, many Indians turned to a different precious metal: silver.
 The pivot wasn’t random. For months, India’s social media stars promoted the idea that after gold’s record rally, silver was next to soar. The hype began in April, when investment banker and content creator Sarthak Ahuja told his nearly 3 million followers that silver’s 100-to-1 price ratio to gold made it the obvious buy this year. His video went viral during Akshaya Tritiya, an auspicious day for buying gold — second only to the Dhanteras festival on Oct. 18.
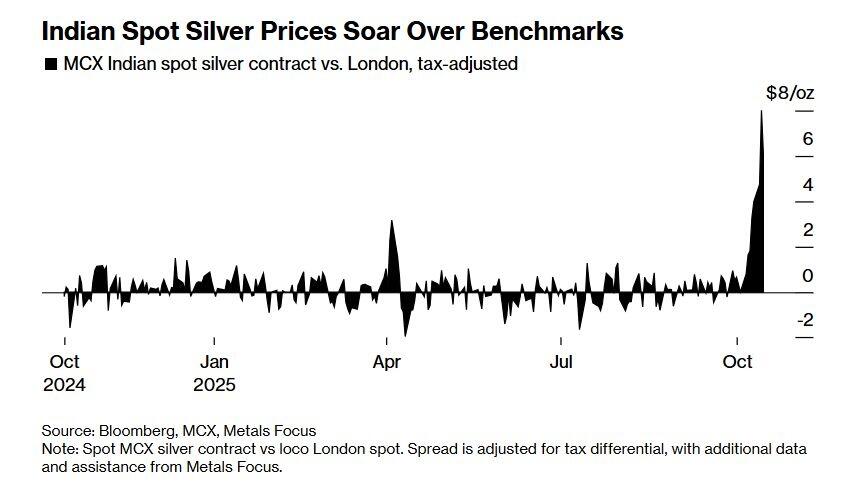
The premiums for silver in India above global prices, usually no more than about a few cents an ounce, started to rise above $0.50, and then above $1, as supplies ran short.
And just as Indian demand was soaring, China — a key source of supply — closed for a week-long holiday. So bullion dealers turned to London.
They soon discovered that the city’s precious metals vaults were largely sold out. While London vaults underpinning the global market hold more than $36 billion in silver, the majority of it was owned by investors in exchange-traded funds.
Demand for silver ETFs has soared in recent months, amid concerns about the stability of the US dollar, a wave of investment that’s become known as the “debasement trade.” Since the start of 2025, ETF investors have hoovered up more than 100 million ounces of silver, according to data compiled by Bloomberg — leaving a dwindling stockpile available to supply the sudden boom in Indian demand.
Premiums soared above $5 an ounce, well beyond the normal spread of a few cents. “I have been here in this company for the last 28 years and I have never seen these kind of premiums,” said M.D. Overseas’s Mittal.
Panic in London
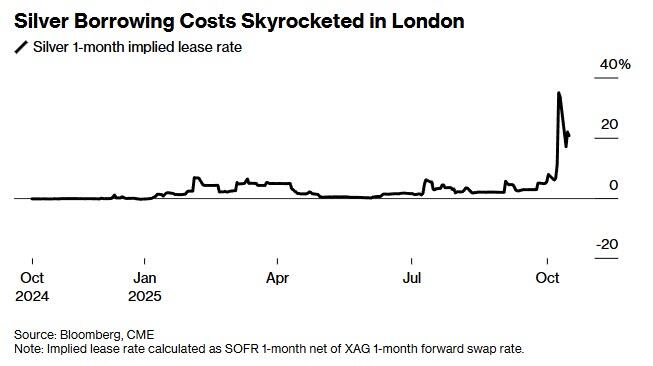
Traders described a growing panic as liquidity dried up. The cost of borrowing silver overnight soared to annualized rates of as high as 200%, according to consultancy Metals Focus. As the big banks that dominate the London market started to step back from the silver market, bid-ask spreads became so wide as to make trading near impossible.
In another sign of the disarray in the market, one trader said the big banks were offering such wildly different quotes that he was able to buy from one bank at its ask price and simultaneously sell to another at its bid for an immediate profit – a rare sign of dysfunction in such a large and competitive market.
For the past five years, silver demand has outstripped silver supply from mines and recycled metal — in large part thanks to a boom in the solar industry, which uses silver in its photovoltaic cells. Since 2021, demand has outstripped supply by a total of 678 million ounces, according to the Silver Institute, with photovoltaic demand more than doubling over the period. That compares to total inventories in London of around 1.1 billion ounces at the start of 2021.
The stress in the silver market has been building since the start of the year, as fears that silver would be ensnared by President Donald Trump’s reciprocal tariffs prompted traders to attempt to front-run any possible levies by shipping more than 200 million ounces of metal into New York warehouses.
The pivot wasn’t random. For months, India’s social media stars promoted the idea that after gold’s record rally, silver was next to soar. The hype began in April, when investment banker and content creator Sarthak Ahuja told his nearly 3 million followers that silver’s 100-to-1 price ratio to gold made it the obvious buy this year. His video went viral during Akshaya Tritiya, an auspicious day for buying gold — second only to the Dhanteras festival on Oct. 18.
The premiums for silver in India above global prices, usually no more than about a few cents an ounce, started to rise above $0.50, and then above $1, as supplies ran short.
And just as Indian demand was soaring, China — a key source of supply — closed for a week-long holiday. So bullion dealers turned to London.
They soon discovered that the city’s precious metals vaults were largely sold out. While London vaults underpinning the global market hold more than $36 billion in silver, the majority of it was owned by investors in exchange-traded funds.
Demand for silver ETFs has soared in recent months, amid concerns about the stability of the US dollar, a wave of investment that’s become known as the “debasement trade.” Since the start of 2025, ETF investors have hoovered up more than 100 million ounces of silver, according to data compiled by Bloomberg — leaving a dwindling stockpile available to supply the sudden boom in Indian demand.
Premiums soared above $5 an ounce, well beyond the normal spread of a few cents. “I have been here in this company for the last 28 years and I have never seen these kind of premiums,” said M.D. Overseas’s Mittal.
Panic in London
Traders described a growing panic as liquidity dried up. The cost of borrowing silver overnight soared to annualized rates of as high as 200%, according to consultancy Metals Focus. As the big banks that dominate the London market started to step back from the silver market, bid-ask spreads became so wide as to make trading near impossible.
In another sign of the disarray in the market, one trader said the big banks were offering such wildly different quotes that he was able to buy from one bank at its ask price and simultaneously sell to another at its bid for an immediate profit – a rare sign of dysfunction in such a large and competitive market.
For the past five years, silver demand has outstripped silver supply from mines and recycled metal — in large part thanks to a boom in the solar industry, which uses silver in its photovoltaic cells. Since 2021, demand has outstripped supply by a total of 678 million ounces, according to the Silver Institute, with photovoltaic demand more than doubling over the period. That compares to total inventories in London of around 1.1 billion ounces at the start of 2021.
The stress in the silver market has been building since the start of the year, as fears that silver would be ensnared by President Donald Trump’s reciprocal tariffs prompted traders to attempt to front-run any possible levies by shipping more than 200 million ounces of metal into New York warehouses.
 On top of the tariff drawdowns, more than 100 million ounces of silver flowed into global ETFs in the year through September, as a wave of investment demand for precious metals supercharged a rally that helped drive gold through $4,000 an ounce for the first time in history.
Together, the two trends drained London’s reserves, leaving dangerously little metal available to underpin the roughly 250 million ounces of silver that change hands in the London market every day. Based on Metals Focus estimates, by early October the “free float” of metal not owned by ETFs in the London silver market had dropped to less than 150 million ounces.
Silver Falls More Than 6% as Precious Metals Retreat After Rally
Also note
On top of the tariff drawdowns, more than 100 million ounces of silver flowed into global ETFs in the year through September, as a wave of investment demand for precious metals supercharged a rally that helped drive gold through $4,000 an ounce for the first time in history.
Together, the two trends drained London’s reserves, leaving dangerously little metal available to underpin the roughly 250 million ounces of silver that change hands in the London market every day. Based on Metals Focus estimates, by early October the “free float” of metal not owned by ETFs in the London silver market had dropped to less than 150 million ounces.
Silver Falls More Than 6% as Precious Metals Retreat After Rally
Also note  Silver fell more than 6% in its biggest drop in six months as the broad precious metals group retreated following a furious rally this week.
Concerns eased over credit quality in the US and trade frictions between China and the US, which is denting haven demand for gold and silver.
A historic squeeze in the silver market in London is also showing signs of easing, prompting some profit-taking by investors.
I see little reason to believe we have seen the end of this rally. There is no fiscal discipline anywhere.
Despite soaring deficits and inflation well above target, the Fed is cutting rates anyway.
Do you have faith in the Congress or Trump to address the deficit? Faith in the Fed?
Neither do I. And neither do gold or silver.
Mon, 10/20/2025 - 14:45
Silver fell more than 6% in its biggest drop in six months as the broad precious metals group retreated following a furious rally this week.
Concerns eased over credit quality in the US and trade frictions between China and the US, which is denting haven demand for gold and silver.
A historic squeeze in the silver market in London is also showing signs of easing, prompting some profit-taking by investors.
I see little reason to believe we have seen the end of this rally. There is no fiscal discipline anywhere.
Despite soaring deficits and inflation well above target, the Fed is cutting rates anyway.
Do you have faith in the Congress or Trump to address the deficit? Faith in the Fed?
Neither do I. And neither do gold or silver.
Mon, 10/20/2025 - 14:45
India’s Largest Metals Refinery Ran Out of Silver for the First Time in History – MishTalk
Sold Out in India, Panic in London
Bloomberg comments https://www.bloomberg.com/news/articles/2025-10-18/sold-out-in-india-panic-in-london-how-the-silver-market-broke
Key Takeaways
Vipin Raina’s company, India’s largest precious metals refinery, ran out of silver stock for the first time in its history due to high demand from Indian customers.
The shortages in India were soon felt globally, with the London silver market also running out of available metal, and traders describing a market that was “all but broken”.
The silver market crisis was caused by a combination of factors, including a multi-year solar power boom, a rush to ship metal to the US to beat possible tariffs, and a sudden spike in demand from India, particularly during the Diwali holiday season.
For months, Vipin Raina had been bracing for a stampede of buying from Indian customers loading up on silver to honor the Hindu goddess of wealth.
But when it came, he was still blown away. At the start of last week, his company, India’s largest precious metals refinery, ran out of silver stock for the first time in its history.
“Most people who are dealing silver and silver coins, they’re literally out of stock because silver is not there,” said Raina, who is head of trading at MMTC-Pamp India Pvt.
“This kind of crazy market — where people are buying at these levels — I have not seen in my 27-year career.”
Within days, the shortages were being felt not just in India, but around the world. India’s festival buyers were joined by international investors and hedge funds piling into precious metals as a bet on the fragility of the US dollar — or simply to follow the market’s irrepressible surge higher.
By the end of last week, the frenzy had rippled across to the London silver market, where global prices are set and where the world’s biggest banks buy and sell in huge quantities. Now, it had run out of available metal. Traders describe a market that was all but broken, where even large banks stepped back from quoting prices as they fielded repeated calls from clients yelling down the line in frustration and exhaustion.
This account of how the silver market broke is based on conversations with more than two dozen traders, bankers, refiners, investors and other market participants, many of whom spoke on condition of anonymity as they weren’t authorized to speak publicly.
100-to-1 Ratio
When traders and analysts try to pinpoint the immediate cause of the silver crisis of 2025, they inevitably point to India.
During the Diwali holiday season, hundreds of millions of devotees buy billions of rupees worth of jewelry to celebrate the goddess Lakshmi. Asia’s refineries usually meet this demand, which typically favors gold. But this year, many Indians turned to a different precious metal: silver.
The pivot wasn’t random. For months, India’s social media stars promoted the idea that after gold’s record rally, silver was next to soar. The hype began in April, when investment banker and content creator Sarthak Ahuja told his nearly 3 million followers that silver’s 100-to-1 price ratio to gold made it the obvious buy this year. His video went viral during Akshaya Tritiya, an auspicious day for buying gold — second only to the Dhanteras festival on Oct. 18.
The premiums for silver in India above global prices, usually no more than about a few cents an ounce, started to rise above $0.50, and then above $1, as supplies ran short.
And just as Indian demand was soaring, China — a key source of supply — closed for a week-long holiday. So bullion dealers turned to London.
They soon discovered that the city’s precious metals vaults were largely sold out. While London vaults underpinning the global market hold more than $36 billion in silver, the majority of it was owned by investors in exchange-traded funds.
Demand for silver ETFs has soared in recent months, amid concerns about the stability of the US dollar, a wave of investment that’s become known as the “debasement trade.” Since the start of 2025, ETF investors have hoovered up more than 100 million ounces of silver, according to data compiled by Bloomberg — leaving a dwindling stockpile available to supply the sudden boom in Indian demand.
Premiums soared above $5 an ounce, well beyond the normal spread of a few cents. “I have been here in this company for the last 28 years and I have never seen these kind of premiums,” said M.D. Overseas’s Mittal.
Panic in London
Traders described a growing panic as liquidity dried up. The cost of borrowing silver overnight soared to annualized rates of as high as 200%, according to consultancy Metals Focus. As the big banks that dominate the London market started to step back from the silver market, bid-ask spreads became so wide as to make trading near impossible.
In another sign of the disarray in the market, one trader said the big banks were offering such wildly different quotes that he was able to buy from one bank at its ask price and simultaneously sell to another at its bid for an immediate profit – a rare sign of dysfunction in such a large and competitive market.
For the past five years, silver demand has outstripped silver supply from mines and recycled metal — in large part thanks to a boom in the solar industry, which uses silver in its photovoltaic cells. Since 2021, demand has outstripped supply by a total of 678 million ounces, according to the Silver Institute, with photovoltaic demand more than doubling over the period. That compares to total inventories in London of around 1.1 billion ounces at the start of 2021.
The stress in the silver market has been building since the start of the year, as fears that silver would be ensnared by President Donald Trump’s reciprocal tariffs prompted traders to attempt to front-run any possible levies by shipping more than 200 million ounces of metal into New York warehouses.
On top of the tariff drawdowns, more than 100 million ounces of silver flowed into global ETFs in the year through September, as a wave of investment demand for precious metals supercharged a rally that helped drive gold through $4,000 an ounce for the first time in history.
Together, the two trends drained London’s reserves, leaving dangerously little metal available to underpin the roughly 250 million ounces of silver that change hands in the London market every day. Based on Metals Focus estimates, by early October the “free float” of metal not owned by ETFs in the London silver market had dropped to less than 150 million ounces.
Silver Falls More Than 6% as Precious Metals Retreat After Rally
Also note Bloomberg.com
Silver Falls More Than 6% as Precious Metals Retreat After Rally
Silver fell more than 6% in its biggest drop in six months as the broad precious metals group retreated following a furious rally this week.
Tyler Durden | Zero Hedge
Zero Hedge
India's Largest Metals Refinery Just Ran Out Of Silver For The First Time In History | ZeroHedge
ZeroHedge - On a long enough timeline, the survival rate for everyone drops to zero
 These two things perfectly characterise their respective presidencies.
Obama’s presidential library in Chicago resembles a prison, while President Trump aspires to restoring beauty, dignity and great architecture to the nation.
The tower is being referred to as a “concrete porta potty” or the Death Star, while the great arch is being labeled the Arc de Trump.
“We have Trump making architecture great again, trying to bring back classical architecture,” the Fox anchors stated, adding “It would meld in VERY nicely with the other monuments.”
🚨 UPDATE: Barack Hussein Obama is building a MONSTROSITY as his presidential library in Chicago - but President Trump is bringing back CLASSICAL, beautiful architecture near the Arlington Memorial Bridge
Obama: Hideous "concrete porta potty"
Trump: Modeled after France's ARC DE…
These two things perfectly characterise their respective presidencies.
Obama’s presidential library in Chicago resembles a prison, while President Trump aspires to restoring beauty, dignity and great architecture to the nation.
The tower is being referred to as a “concrete porta potty” or the Death Star, while the great arch is being labeled the Arc de Trump.
“We have Trump making architecture great again, trying to bring back classical architecture,” the Fox anchors stated, adding “It would meld in VERY nicely with the other monuments.”
🚨 UPDATE: Barack Hussein Obama is building a MONSTROSITY as his presidential library in Chicago - but President Trump is bringing back CLASSICAL, beautiful architecture near the Arlington Memorial Bridge
Obama: Hideous "concrete porta potty"
Trump: Modeled after France's ARC DE… 


 What's more is that Zelensky wants to use Russian funds to buy the air defense missiles. "Speaking in Kyiv after talks with Trump and American weapons-makers, Zelenskyy said Ukraine needed 25 US Patriot anti-missile batteries and that Russia's frozen assets in the west should be used to buy them,"

 But that is a difficult skill to master.
Yes, thinking like a bear means you are aware of the exceedingly high levels of investor complacency, that valuations are stretched, and credit spreads have been crushed. Furthermore, margin debt is at very high levels, which provides the fuel for the eventual downturn.
But that is a difficult skill to master.
Yes, thinking like a bear means you are aware of the exceedingly high levels of investor complacency, that valuations are stretched, and credit spreads have been crushed. Furthermore, margin debt is at very high levels, which provides the fuel for the eventual downturn.
 The problem with speculative bull runs is that they always end, and most of the time that ending is destructive. It is inherently logical that, as an investor, you want to move to protect your capital. The problem is that a bearish posture can lead to more severe underperformance because the market is in full speculative mode. Such is why, as an investor, it is logical to engage in bearish thinking, but must maintain a bullish bias amid a bull run. That means you must engage selectively, ride momentum where it leads, and keep disciplined exits.
As noted, that is a difficult skill to master, but that is your edge: you see the warning signs, yet you don’t surrender to them too early.
Howard Marks once argued that psychology overwhelmingly defines speculative bull runs. Price divorces value as crowds chase narratives. While the optimists win short-term, and the pessimists are mocked, Marks warns that during these periods, “value” takes a back seat and momentum becomes the dominant force. Marks underscored that manias shift the center of gravity from intrinsic worth to consensus euphoria. So when you think like a bear, your job is not to dogmatically short every overvalued name, but to structure your exposure to survive the mania’s reversal.
However, marrying the two mindsets is challenging. While valuation models can anchor your long‑term expectations, near-term indicators like relative strength and momentum overlays can help navigate potentially dangerous waters. Like any good captain in uncharted waters, they follow the navigation but pay attention to their instincts.
Why Fundamental Analysis Alone Fails in Mania Mode
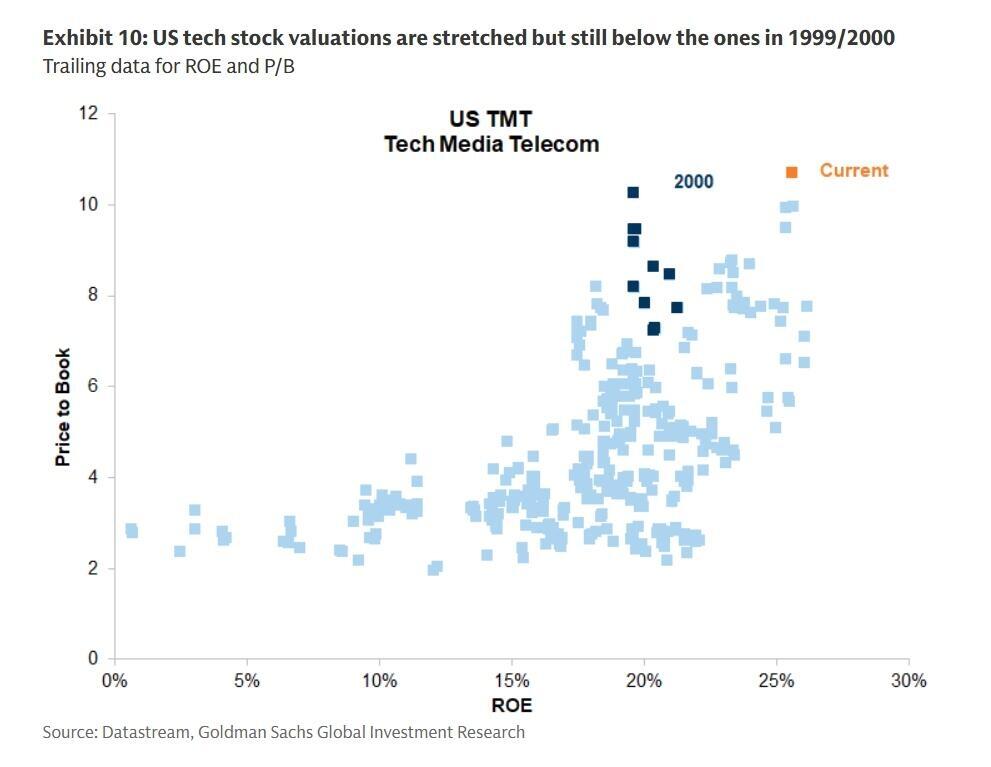
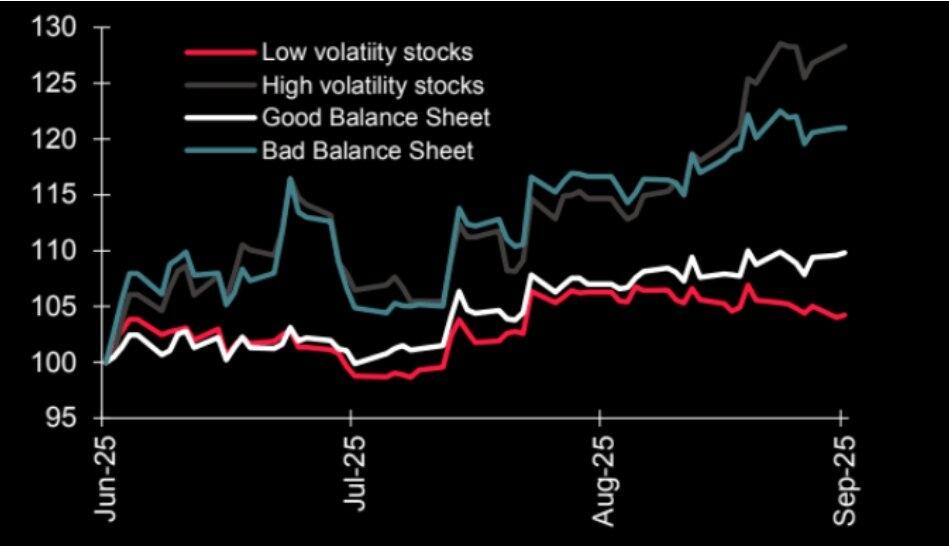
Under normal conditions, valuation metrics drive returns. You buy cheap (low P/S, high free cash flow yield, strong ROE) and wait for mean reversion. But in a speculative bull run, those rules often fail. As discussed recently, high volatility and “bad balance sheet” (poor fundamentals) are what investors are chasing. That is because the perceived risk of loss is extremely low, even though it is not.
The problem with speculative bull runs is that they always end, and most of the time that ending is destructive. It is inherently logical that, as an investor, you want to move to protect your capital. The problem is that a bearish posture can lead to more severe underperformance because the market is in full speculative mode. Such is why, as an investor, it is logical to engage in bearish thinking, but must maintain a bullish bias amid a bull run. That means you must engage selectively, ride momentum where it leads, and keep disciplined exits.
As noted, that is a difficult skill to master, but that is your edge: you see the warning signs, yet you don’t surrender to them too early.
Howard Marks once argued that psychology overwhelmingly defines speculative bull runs. Price divorces value as crowds chase narratives. While the optimists win short-term, and the pessimists are mocked, Marks warns that during these periods, “value” takes a back seat and momentum becomes the dominant force. Marks underscored that manias shift the center of gravity from intrinsic worth to consensus euphoria. So when you think like a bear, your job is not to dogmatically short every overvalued name, but to structure your exposure to survive the mania’s reversal.
However, marrying the two mindsets is challenging. While valuation models can anchor your long‑term expectations, near-term indicators like relative strength and momentum overlays can help navigate potentially dangerous waters. Like any good captain in uncharted waters, they follow the navigation but pay attention to their instincts.
Why Fundamental Analysis Alone Fails in Mania Mode
Under normal conditions, valuation metrics drive returns. You buy cheap (low P/S, high free cash flow yield, strong ROE) and wait for mean reversion. But in a speculative bull run, those rules often fail. As discussed recently, high volatility and “bad balance sheet” (poor fundamentals) are what investors are chasing. That is because the perceived risk of loss is extremely low, even though it is not.
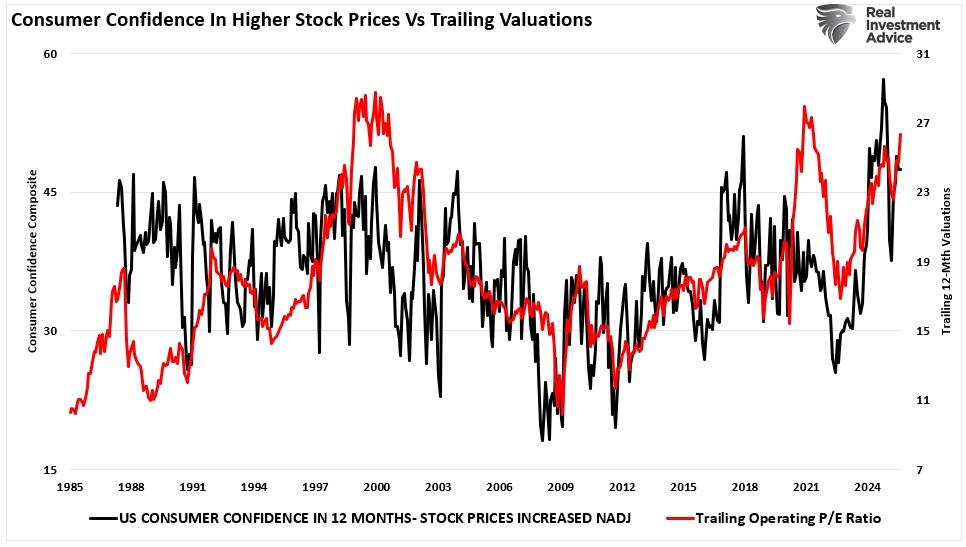
 But that is what happens during market manias. As the crowd chases momentum and dismisses warnings, it pushes prices beyond what the underlying assets justify. This is what is called “valuation expansion.” As shown below, valuations, in the short term, reflect consumer (investor) sentiment. The chart shows the correlation between consumers’ expectations of higher prices in 12 months versus trailing 12-month valuations.
 Warren Buffett emphasized this point, stating that in speculative manias, the market becomes a voting machine first (popularity), then later a weighing machine (intrinsic value). In mania phases, price can outrun value over long periods before eventually reverting. Betting on the value convergence too early is dangerous. The reason, as John Maynard Keynes noted, is that.“The market can remain irrational longer than you can remain solvent.”
As we discussed in a recent
Warren Buffett emphasized this point, stating that in speculative manias, the market becomes a voting machine first (popularity), then later a weighing machine (intrinsic value). In mania phases, price can outrun value over long periods before eventually reverting. Betting on the value convergence too early is dangerous. The reason, as John Maynard Keynes noted, is that.“The market can remain irrational longer than you can remain solvent.”
As we discussed in a recent That’s why fighting parabolic moves can be so problematic. As Peter Lynch once stated:
“Far more money has been lost by investors preparing for corrections, or trying to anticipate corrections, than has been lost in the corrections themselves.”
Thus, if you followed pure valuation discipline, you would often be sidelined during the high-return leg. Worse, you might have to “catch the knife” when the reversal begins. So you need to adapt your thinking to allow “bearishness” to control risk, but remain “bullish” to allow for the fact that momentum may temporarily drive prices higher..
One pitfall, however, is correlation. Historically non-correlated assets in speculative environments will move in tandem as investors look for the next speculative opportunity. Large-cap, high volatility, emerging market, international, gold, and bitcoin are all being chased higher in the current market. Each has its own narrative to justify its move higher, but buyers’ speculative fervor outstripping supply pushes prices further. In this environment, traditional diversification will likely fail to protect you in a downturn. Your differentiation comes from picking “which” levered momentum plays to hold and having triggers to exit them before they become toxic.
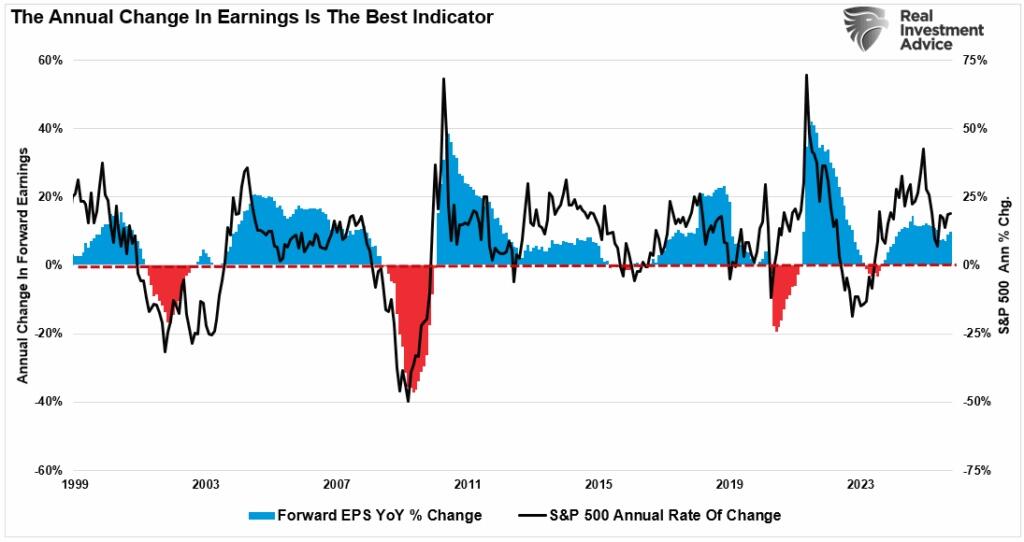
The good news is that markets do not collapse at once, and you will not wake up one morning with stocks down 50%. Instead, the initial sharp move lower will signal that some market “dynamic” has shifted. No one will ever know what that will be in advance. However, it will be an event that causes investors to “revalue” their forward earnings estimates. If those estimates decline, the current market will be repriced for lower future earnings. As shown, there is a high correlation between the market and the 12-month rate of change in forward earnings estimates.
That’s why fighting parabolic moves can be so problematic. As Peter Lynch once stated:
“Far more money has been lost by investors preparing for corrections, or trying to anticipate corrections, than has been lost in the corrections themselves.”
Thus, if you followed pure valuation discipline, you would often be sidelined during the high-return leg. Worse, you might have to “catch the knife” when the reversal begins. So you need to adapt your thinking to allow “bearishness” to control risk, but remain “bullish” to allow for the fact that momentum may temporarily drive prices higher..
One pitfall, however, is correlation. Historically non-correlated assets in speculative environments will move in tandem as investors look for the next speculative opportunity. Large-cap, high volatility, emerging market, international, gold, and bitcoin are all being chased higher in the current market. Each has its own narrative to justify its move higher, but buyers’ speculative fervor outstripping supply pushes prices further. In this environment, traditional diversification will likely fail to protect you in a downturn. Your differentiation comes from picking “which” levered momentum plays to hold and having triggers to exit them before they become toxic.
The good news is that markets do not collapse at once, and you will not wake up one morning with stocks down 50%. Instead, the initial sharp move lower will signal that some market “dynamic” has shifted. No one will ever know what that will be in advance. However, it will be an event that causes investors to “revalue” their forward earnings estimates. If those estimates decline, the current market will be repriced for lower future earnings. As shown, there is a high correlation between the market and the 12-month rate of change in forward earnings estimates.
 The lesson is that valuation signals are essential but insufficient. You need momentum lenses, risk thresholds, and rules for scaling exposure and exiting when conditions shift. These give you a fighting chance in a speculative bull run.
How to Manage Risk & Exposure During the Mania
You have a framework now: think like a bear, engage like a bull, and overlay defenses. But how do you operationalize that in real portfolios? Below are the steps and principles from our approach and Mark’s wisdom.
Establish trend break rules and define when the trend is broken. Use moving averages, momentum divergences, or multi‑timeframe trend signals. When a trend breaks, reduce exposure.
Scale into exposure. Don’t go all in at once. Add when strength confirms. If the market corrects, your position is still manageable.
Use stop zones and dynamic trailing thresholds. Set stop levels or trailing stops that adapt. Cut losers early. Lock in profits on winners when they begin to stall.
Tier exposure by risk class. Have distinct layers: value core, momentum growth sleeve, and optional speculative layer. The speculative layer should be small, optional, and easy to cut.
Monitor outside‑equity signals. Watch credit spreads, yield curves, bond markets, and sentiment extremes. Those often show cracks before equities do.
Transition to a defensive posture incrementally. Move from “stop buying” to “reduce aggressive holdings” rather than all at once. You don’t have to hit complete defense unless the trends demand.
Always maintain optionality. Hold dry powder. Leave capacity to enter new momentum trends or reallocate when the old ones shed. You want to be able to pivot.
Accept uncertainty and probabilistic thinking. Risk and probability matter more than certainty. You can’t know exactly when the shift happens, but you can manage positioning around probabilities.
Be unemotional and contrarian at extremes. Great investors are unemotional. In extremes, follow contrarian logic: reduce exposure when others lean heavily in. Resist being swept by sentiment. At mania highs, the crowd is usually at its most overextended.
Review and adapt constantly. Conditions change. What looks good today may become a trap tomorrow. Stay vigilant. Reassess allocations regularly.
By applying these rules, you can capture much of the upside of a speculative market while protecting against the inevitable reversion.
A Roadmap: Where This Strategy Wins and When It Loses
This hybrid approach is not perfect. There are strengths, and there are risks. But it’s more durable than rigid value or blind momentum.
When it wins:
During strong speculative rallies, where momentum dominates, investors can participate in the gains and avoid collapsing names.
Technical signals can keep investors aligned with the market in environments where fundamentals are weak but liquidity and psychology are strong.
When the trend eventually breaks, stop rules trigger exits, preserving investor capital.
When it struggles:
Momentum-based strategies will fail if the trend reverses abruptly and violently without warning.
During choppy market phases, investors will likely suffer underperformance when the trend direction is unclear, as trend signals whipsaw.
A pure value strategy will outperform in sustained value-driven rebounds (after deep crashes), where fundamentals again dominate.
You mitigate those risks by:
Staying light in speculative exposures
Keeping a strong value core
Loosening stop logic in volatile whipsaw phases
Being ready to switch investment strategies when the cycle changes
The path isn’t perfect, but it gives you flexibility.
Think Like a Bear, Invest Like A Bull
In today’s market environment, where risk is elevated, it can pay to “think like a bear, but invest like a bull.” As Howard Marks previously wrote about navigating speculative manias:
“In hot times, the few who do remember the past are dismissed as relics of the old, lacking the ability to imagine the new. But it invariably turns out that there’s nothing new in terms of investor behavior. Mark Twain said that “history does not repeat itself, but it does rhyme,” and what rhymes are the important themes.
The bottom line is that even though knowing financial history is important, requiring people to study it won’t make a big difference, because they’ll ignore its lessons. There’s a very strong tendency for people to believe in things which, if true, would make them rich. As Demosthenes said, “For that a man wishes, he generally believes to be true”
Just like in the movies, where they show a person in a dilemma to have an angel on one side and a devil on the other, in the case of investing, investors have prudence and memory on one shoulder and greed on the other. Most of the time greed wins. As long as human nature is part of the investment environment, which it always will be, we’ll experience bubbles and crashes.“
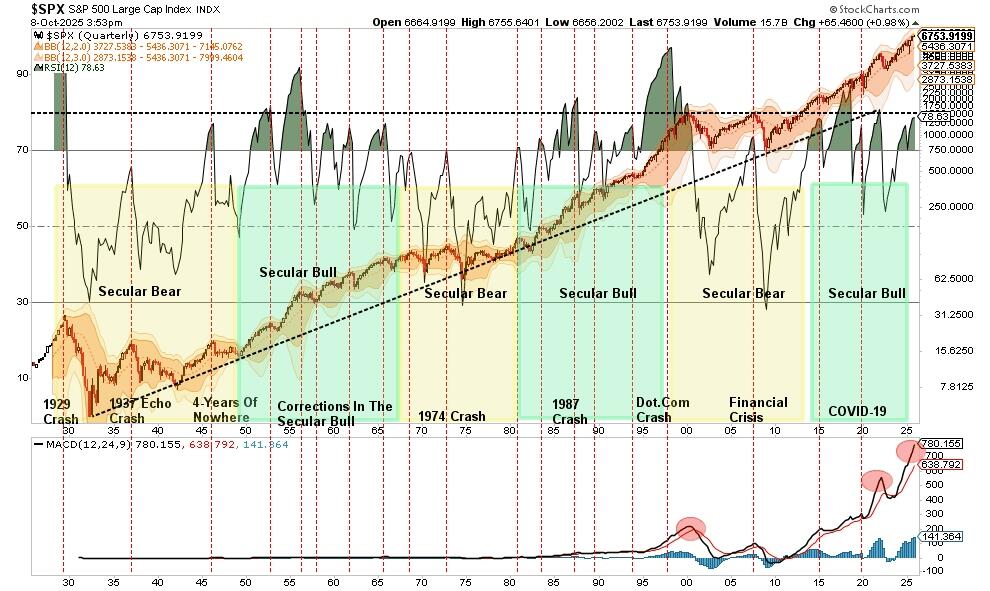
There have only been a few points in history where the market is as overbought and extended, technically, as it is currently.
The lesson is that valuation signals are essential but insufficient. You need momentum lenses, risk thresholds, and rules for scaling exposure and exiting when conditions shift. These give you a fighting chance in a speculative bull run.
How to Manage Risk & Exposure During the Mania
You have a framework now: think like a bear, engage like a bull, and overlay defenses. But how do you operationalize that in real portfolios? Below are the steps and principles from our approach and Mark’s wisdom.
Establish trend break rules and define when the trend is broken. Use moving averages, momentum divergences, or multi‑timeframe trend signals. When a trend breaks, reduce exposure.
Scale into exposure. Don’t go all in at once. Add when strength confirms. If the market corrects, your position is still manageable.
Use stop zones and dynamic trailing thresholds. Set stop levels or trailing stops that adapt. Cut losers early. Lock in profits on winners when they begin to stall.
Tier exposure by risk class. Have distinct layers: value core, momentum growth sleeve, and optional speculative layer. The speculative layer should be small, optional, and easy to cut.
Monitor outside‑equity signals. Watch credit spreads, yield curves, bond markets, and sentiment extremes. Those often show cracks before equities do.
Transition to a defensive posture incrementally. Move from “stop buying” to “reduce aggressive holdings” rather than all at once. You don’t have to hit complete defense unless the trends demand.
Always maintain optionality. Hold dry powder. Leave capacity to enter new momentum trends or reallocate when the old ones shed. You want to be able to pivot.
Accept uncertainty and probabilistic thinking. Risk and probability matter more than certainty. You can’t know exactly when the shift happens, but you can manage positioning around probabilities.
Be unemotional and contrarian at extremes. Great investors are unemotional. In extremes, follow contrarian logic: reduce exposure when others lean heavily in. Resist being swept by sentiment. At mania highs, the crowd is usually at its most overextended.
Review and adapt constantly. Conditions change. What looks good today may become a trap tomorrow. Stay vigilant. Reassess allocations regularly.
By applying these rules, you can capture much of the upside of a speculative market while protecting against the inevitable reversion.
A Roadmap: Where This Strategy Wins and When It Loses
This hybrid approach is not perfect. There are strengths, and there are risks. But it’s more durable than rigid value or blind momentum.
When it wins:
During strong speculative rallies, where momentum dominates, investors can participate in the gains and avoid collapsing names.
Technical signals can keep investors aligned with the market in environments where fundamentals are weak but liquidity and psychology are strong.
When the trend eventually breaks, stop rules trigger exits, preserving investor capital.
When it struggles:
Momentum-based strategies will fail if the trend reverses abruptly and violently without warning.
During choppy market phases, investors will likely suffer underperformance when the trend direction is unclear, as trend signals whipsaw.
A pure value strategy will outperform in sustained value-driven rebounds (after deep crashes), where fundamentals again dominate.
You mitigate those risks by:
Staying light in speculative exposures
Keeping a strong value core
Loosening stop logic in volatile whipsaw phases
Being ready to switch investment strategies when the cycle changes
The path isn’t perfect, but it gives you flexibility.
Think Like a Bear, Invest Like A Bull
In today’s market environment, where risk is elevated, it can pay to “think like a bear, but invest like a bull.” As Howard Marks previously wrote about navigating speculative manias:
“In hot times, the few who do remember the past are dismissed as relics of the old, lacking the ability to imagine the new. But it invariably turns out that there’s nothing new in terms of investor behavior. Mark Twain said that “history does not repeat itself, but it does rhyme,” and what rhymes are the important themes.
The bottom line is that even though knowing financial history is important, requiring people to study it won’t make a big difference, because they’ll ignore its lessons. There’s a very strong tendency for people to believe in things which, if true, would make them rich. As Demosthenes said, “For that a man wishes, he generally believes to be true”
Just like in the movies, where they show a person in a dilemma to have an angel on one side and a devil on the other, in the case of investing, investors have prudence and memory on one shoulder and greed on the other. Most of the time greed wins. As long as human nature is part of the investment environment, which it always will be, we’ll experience bubbles and crashes.“
There have only been a few points in history where the market is as overbought and extended, technically, as it is currently.
 Given that knowledge, investors must learn to live in tension. Think like a bear, so you’re ready for danger. Invest like a bull to participate in the current wealth-building opportunity. No rule says you can ONLY be a bull or a bear. It is okay, and logical, to be a bit of both.
Critically, you must adopt probabilistic thinking and reject certainty.
This combined approach gives you a fighting chance in environments where liquidity and psychology override fundamentals. It also preserves your survival when sentiment eventually reverses.
Given that knowledge, investors must learn to live in tension. Think like a bear, so you’re ready for danger. Invest like a bull to participate in the current wealth-building opportunity. No rule says you can ONLY be a bull or a bear. It is okay, and logical, to be a bit of both.
Critically, you must adopt probabilistic thinking and reject certainty.
This combined approach gives you a fighting chance in environments where liquidity and psychology override fundamentals. It also preserves your survival when sentiment eventually reverses.
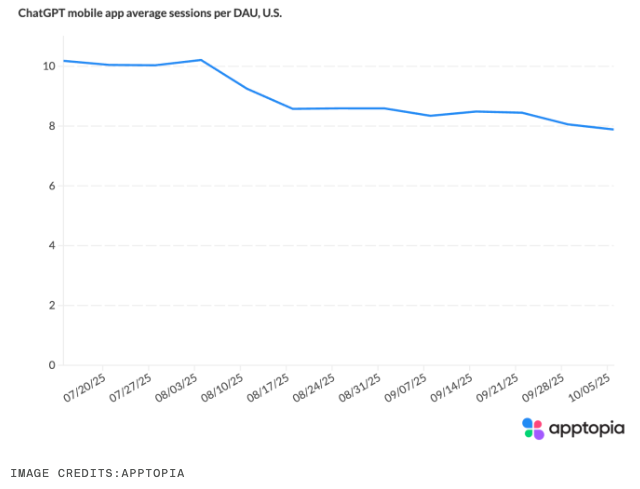
 In the U.S...
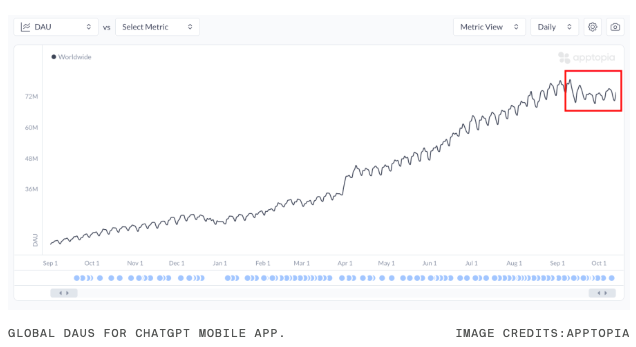
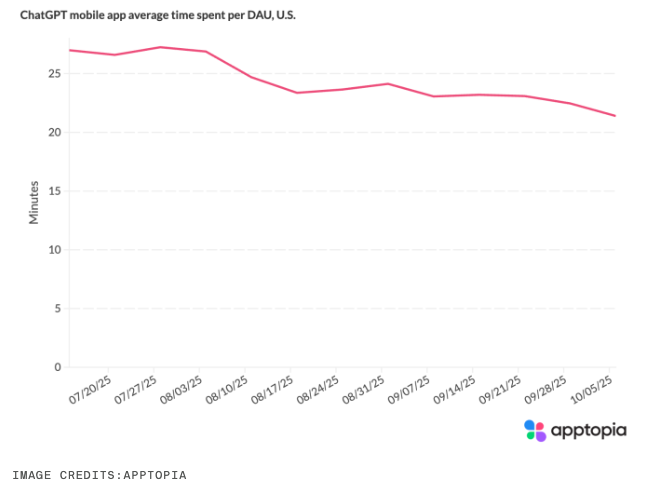 And more evidence that ChatGPT's hype is fading.
 Fueling the data center bubble and breaking down how the giant "circle jerk" works, we exposed the
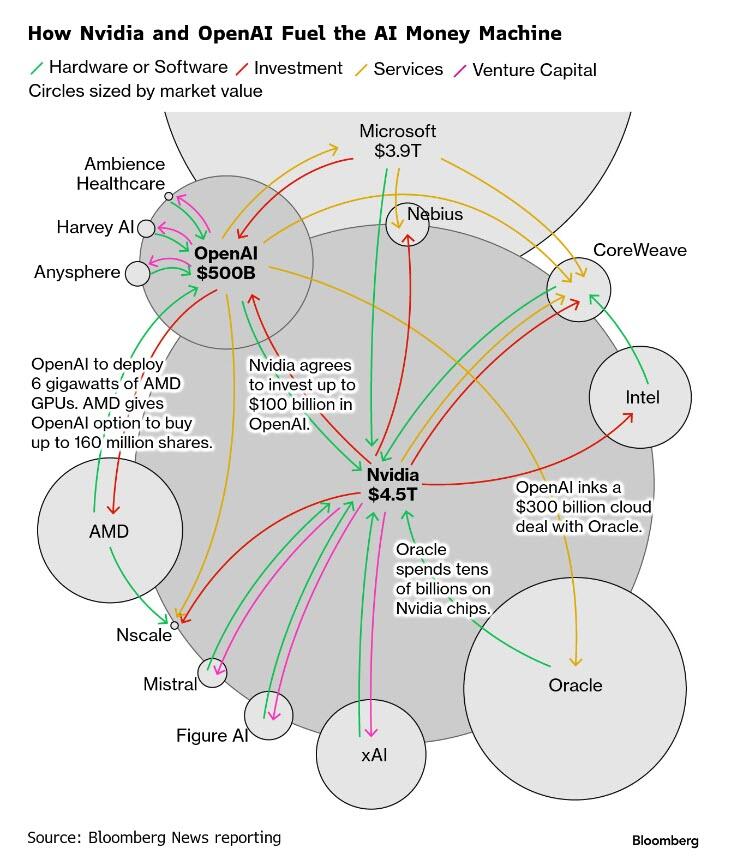
 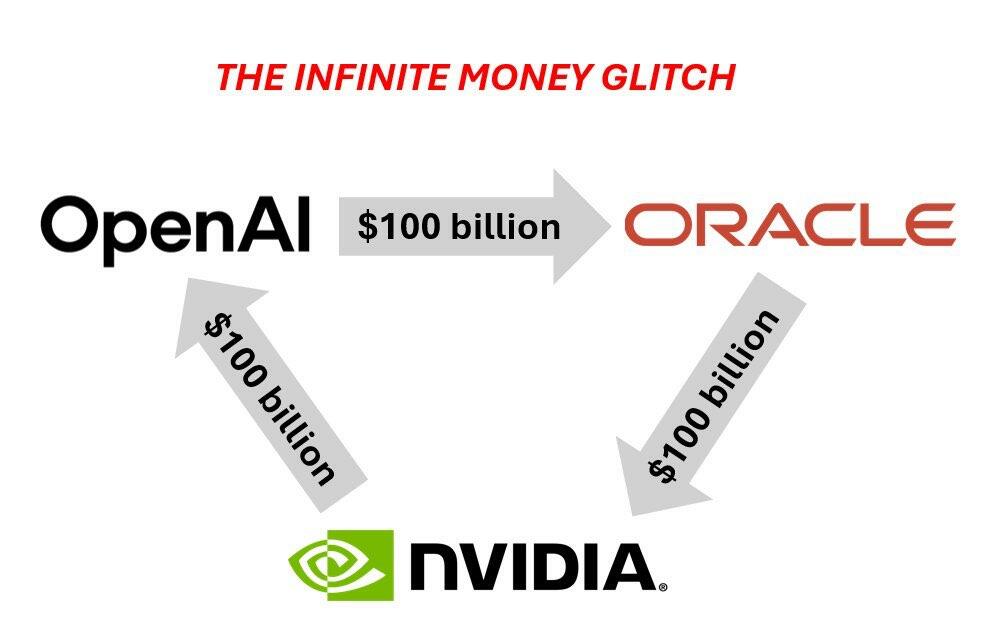 More complex via Bloomberg.
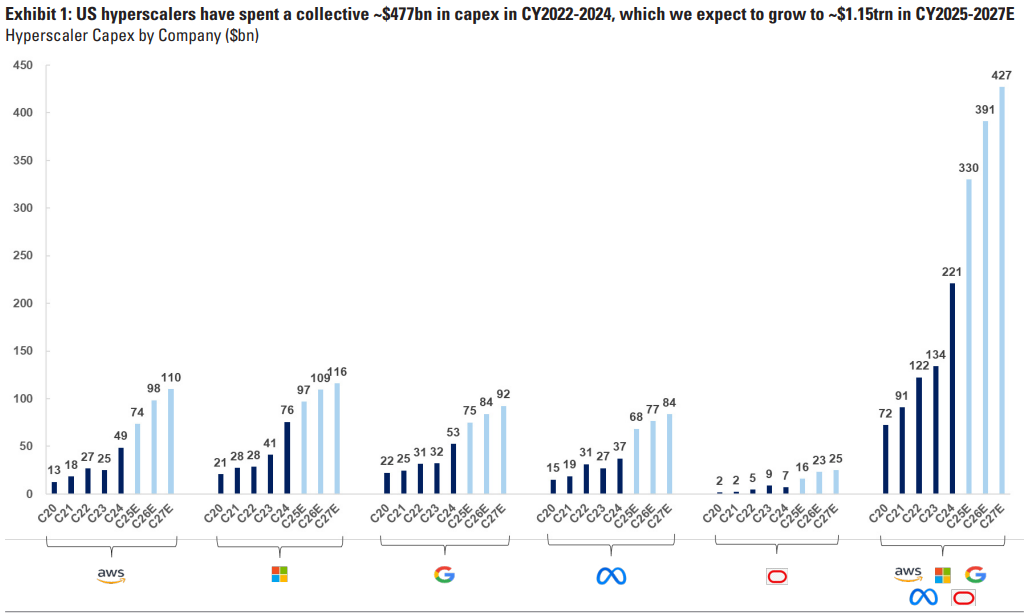
 Super impressive Capex by hyperscalers.
 And comes as:
 AWS' Service Health Dashboard shows "operational issues" in its US-East-1 region (Northern Virginia), one of its largest data centers.
 What’s happening:
Several AWS services, including DynamoDB and others, are experiencing slow performance (high latency) or failures (high error rates).
Impact:
Apps and websites that rely on AWS may be loading slowly, timing out, or not working at all.
Users may be unable to create or update support cases through AWS' help system.
Widespread slowdowns and outages are being reported across major platforms that depend on Amazon's cloud, including Snapchat, Roblox, Amazon Alexa, Fortnite, Ring, Robinhood, Venmo, Lyft, and many others.
What’s happening:
Several AWS services, including DynamoDB and others, are experiencing slow performance (high latency) or failures (high error rates).
Impact:
Apps and websites that rely on AWS may be loading slowly, timing out, or not working at all.
Users may be unable to create or update support cases through AWS' help system.
Widespread slowdowns and outages are being reported across major platforms that depend on Amazon's cloud, including Snapchat, Roblox, Amazon Alexa, Fortnite, Ring, Robinhood, Venmo, Lyft, and many others.
 There's no official statement yet on what sparked the outage at AWS' Virginia data centers.
Developing.
There's no official statement yet on what sparked the outage at AWS' Virginia data centers.
Developing.
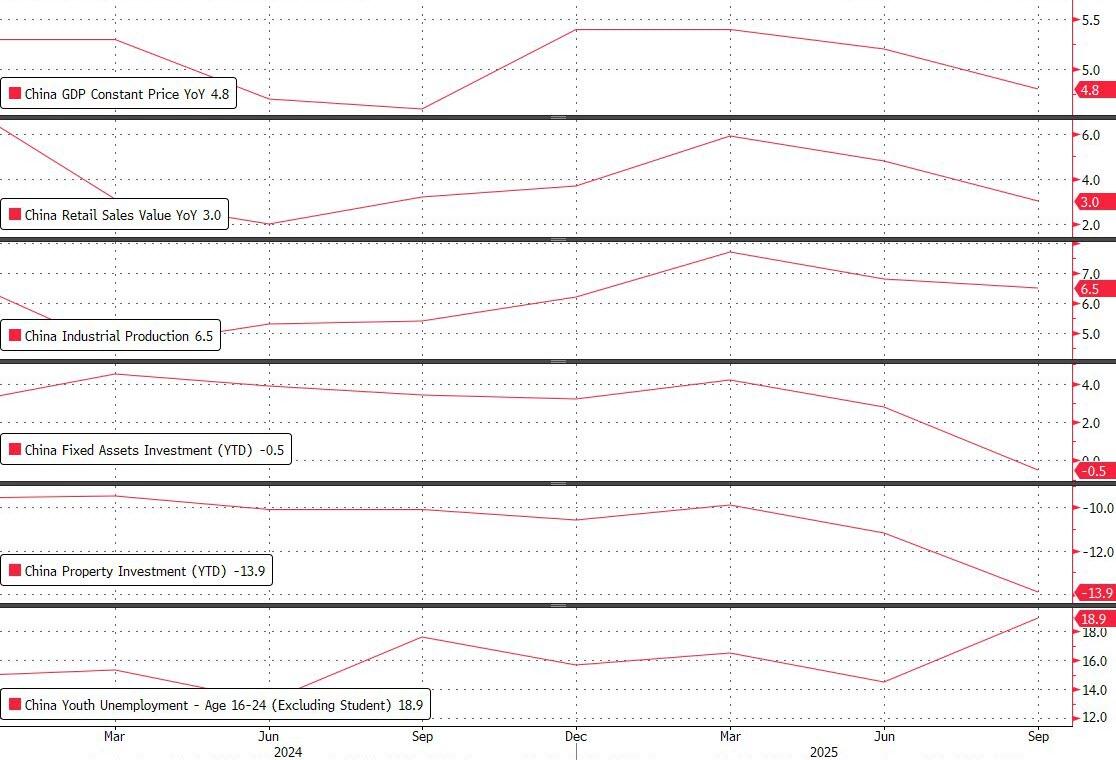
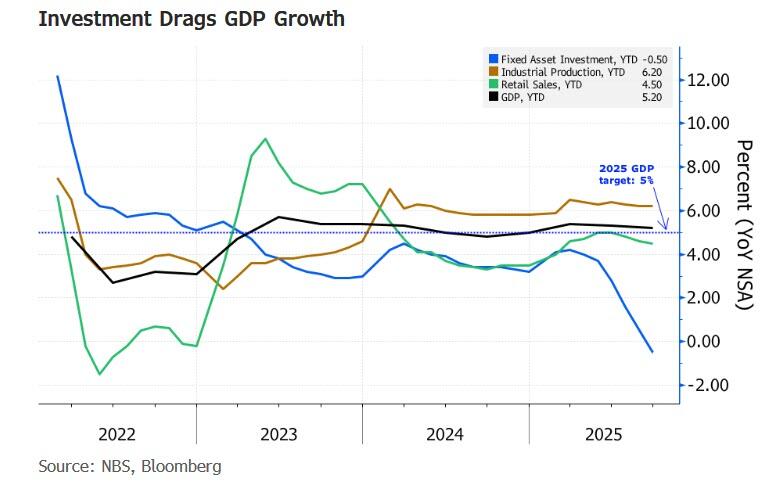
 The rest of the Chinese data dump overnight was mixed:
Retail Sales came in line with expectations at 3.0% YoY (exp. 3.0%)
Industrial Output beat expectations, printing at 6.5% YoY (exp. 5.0%)
Fixed Investment missed expectations, printing down 0.5% for th Jan-Sept period (exp. 0.1%)
The rest of the Chinese data dump overnight was mixed:
Retail Sales came in line with expectations at 3.0% YoY (exp. 3.0%)
Industrial Output beat expectations, printing at 6.5% YoY (exp. 5.0%)
Fixed Investment missed expectations, printing down 0.5% for th Jan-Sept period (exp. 0.1%)
 Some notes here from Goldman:
Industrial production (IP): +6.5% yoy in September (consensus: +5.0% yoy), vs. +5.2% yoy in August. Note sequential figures are highly sensitive to the specific seasonal adjustment methodology (NBS estimates: +0.6% mom sa non-annualized in September, vs. +0.4% mom sa non-annualized in August; GS estimates: +1.4% mom sa non-annualized in September, vs. 0% mom sa non-annualized in August).
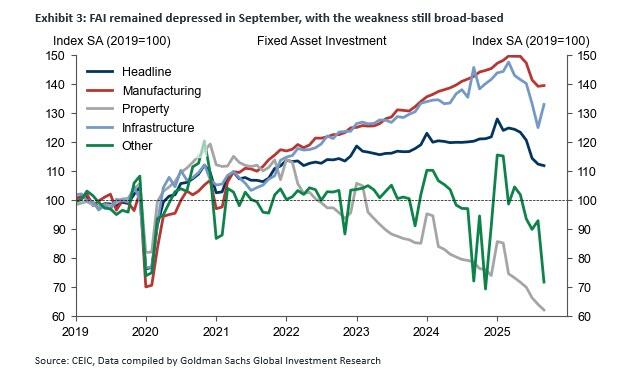
Fixed asset investment (FAI): -0.5% ytd yoy in September (consensus: +0.1% ytd yoy), vs. +0.5% ytd yoy in August; September single-month by GS estimates: -6.7% yoy, vs. -6.8% yoy in August (sequential growth by GS estimates: -0.5% mom sa non-annualized in September, vs. -1.3% mom sa non-annualized in August).
Retail sales: +3.0% yoy in September (consensus: +3.0% yoy), vs. +3.4% yoy in August (sequential growth by GS estimates: +0.2% mom sa non-annualized in September, vs. -0.3% mom sa non-annualized in August).
Services industry output index: +5.6% yoy in September, vs. +5.6% yoy in August (sequential growth by GS estimates: +0.7% mom sa non-annualized in September, vs. +0.4% mom sa non-annualized in August).
Main points:
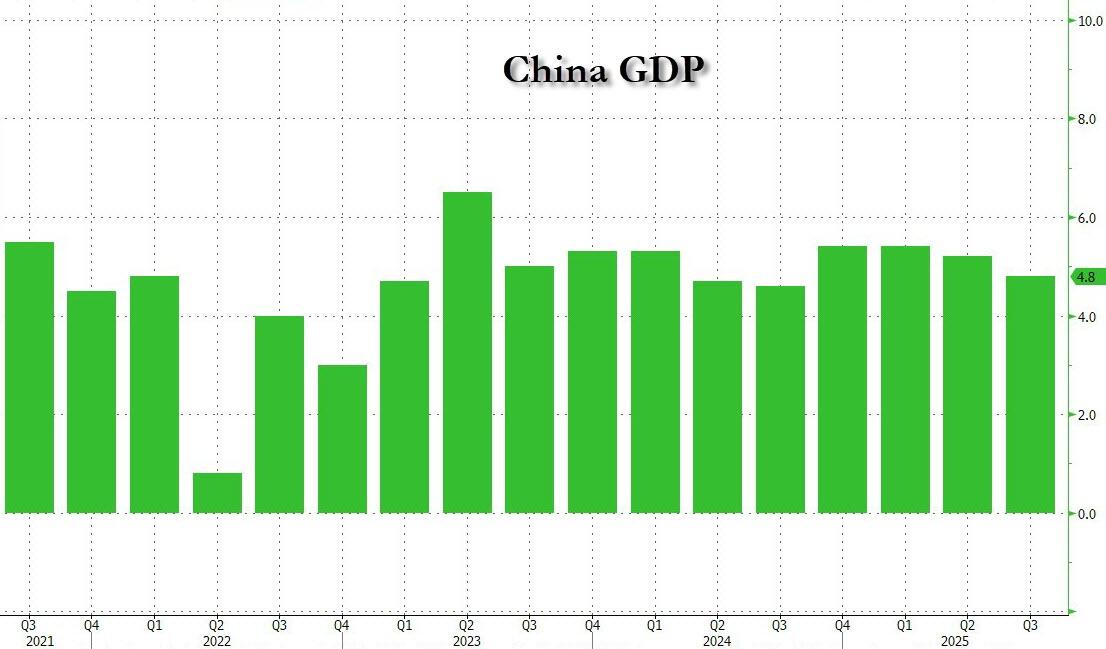
1. Based on NBS estimates, China’s real GDP growth moderated to 4.8% yoy in Q3 from 5.2% yoy in Q2, marginally above market consensus (4.7% yoy) on the back of US tariff impact gradually kicking in, fading effectiveness of some existing easing measures (e.g., the government-subsidized consumer goods trade-in program) and more adverse than usual weather conditions (mainly in July-August). In sequential terms, NBS estimated that real GDP growth edged up to 1.1% qoq sa non-annualized in Q3 from the downwardly revised 1.0% qoq sa non-annualized in Q2. NBS raised its sequential growth estimate slightly for Q3 2024 (to 1.5% qoq non-annualized from 1.3% qoq non-annualized previously), but lowered it slightly for Q4 2024 (to 1.5% qoq annualized from 1.6% qoq non-annualized previously). The official sequential GDP growth of 4.5% qoq annualized (implied by the 1.1% qoq non-annualized growth) is slightly below Goldman's Current Activity Indicator (CAI) tracking of around 5.2% annualized growth in Q3. Year-on-year nominal GDP growth declined to 3.7% in Q3 from 3.9% in Q2 and GDP deflator has been negative for 10 quarters in a row.
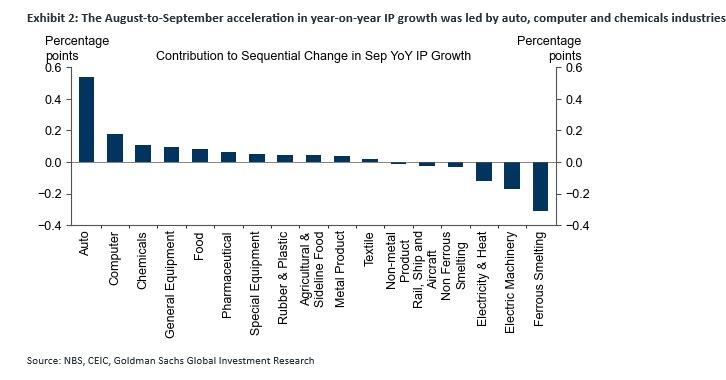
2. Industrial production (IP) growth rose to 6.5% yoy in September from 5.2% yoy in August thanks partly to the stronger-than-expected exports and an acceleration in auto output growth. On a sequential basis after seasonal adjustments, IP gained 1.4% mom non-annualized in September (vs. 0% mom non-annualized in August; Exhibit 1). By industry, the August-to-September acceleration in year-on-year IP growth was led by faster output growth in auto, computer and chemicals industries, more than offsetting slower output growth in the ferrous metal smelting industry (Exhibit 2). Among major industrial products (different from by-industry breakdown), auto output growth increased to +13.7% yoy in September from +10.5% yoy in August; computer and industrial robot output growth rose to -5.8% yoy and +28.3% yoy, respectively, in September from -13.1% yoy and +14.4% yoy in August. By comparison, year-on-year growth in power generation and cement output slowed to +1.5% and -8.6%, respectively, in September from +1.6% and -6.2% in August. Crude steel output growth dropped to -4.6% yoy in September from -0.7% yoy in August, and smartphone output growth also eased to +0.1% yoy from +3.2% yoy.
Some notes here from Goldman:
Industrial production (IP): +6.5% yoy in September (consensus: +5.0% yoy), vs. +5.2% yoy in August. Note sequential figures are highly sensitive to the specific seasonal adjustment methodology (NBS estimates: +0.6% mom sa non-annualized in September, vs. +0.4% mom sa non-annualized in August; GS estimates: +1.4% mom sa non-annualized in September, vs. 0% mom sa non-annualized in August).
Fixed asset investment (FAI): -0.5% ytd yoy in September (consensus: +0.1% ytd yoy), vs. +0.5% ytd yoy in August; September single-month by GS estimates: -6.7% yoy, vs. -6.8% yoy in August (sequential growth by GS estimates: -0.5% mom sa non-annualized in September, vs. -1.3% mom sa non-annualized in August).
Retail sales: +3.0% yoy in September (consensus: +3.0% yoy), vs. +3.4% yoy in August (sequential growth by GS estimates: +0.2% mom sa non-annualized in September, vs. -0.3% mom sa non-annualized in August).
Services industry output index: +5.6% yoy in September, vs. +5.6% yoy in August (sequential growth by GS estimates: +0.7% mom sa non-annualized in September, vs. +0.4% mom sa non-annualized in August).
Main points:
1. Based on NBS estimates, China’s real GDP growth moderated to 4.8% yoy in Q3 from 5.2% yoy in Q2, marginally above market consensus (4.7% yoy) on the back of US tariff impact gradually kicking in, fading effectiveness of some existing easing measures (e.g., the government-subsidized consumer goods trade-in program) and more adverse than usual weather conditions (mainly in July-August). In sequential terms, NBS estimated that real GDP growth edged up to 1.1% qoq sa non-annualized in Q3 from the downwardly revised 1.0% qoq sa non-annualized in Q2. NBS raised its sequential growth estimate slightly for Q3 2024 (to 1.5% qoq non-annualized from 1.3% qoq non-annualized previously), but lowered it slightly for Q4 2024 (to 1.5% qoq annualized from 1.6% qoq non-annualized previously). The official sequential GDP growth of 4.5% qoq annualized (implied by the 1.1% qoq non-annualized growth) is slightly below Goldman's Current Activity Indicator (CAI) tracking of around 5.2% annualized growth in Q3. Year-on-year nominal GDP growth declined to 3.7% in Q3 from 3.9% in Q2 and GDP deflator has been negative for 10 quarters in a row.
2. Industrial production (IP) growth rose to 6.5% yoy in September from 5.2% yoy in August thanks partly to the stronger-than-expected exports and an acceleration in auto output growth. On a sequential basis after seasonal adjustments, IP gained 1.4% mom non-annualized in September (vs. 0% mom non-annualized in August; Exhibit 1). By industry, the August-to-September acceleration in year-on-year IP growth was led by faster output growth in auto, computer and chemicals industries, more than offsetting slower output growth in the ferrous metal smelting industry (Exhibit 2). Among major industrial products (different from by-industry breakdown), auto output growth increased to +13.7% yoy in September from +10.5% yoy in August; computer and industrial robot output growth rose to -5.8% yoy and +28.3% yoy, respectively, in September from -13.1% yoy and +14.4% yoy in August. By comparison, year-on-year growth in power generation and cement output slowed to +1.5% and -8.6%, respectively, in September from +1.6% and -6.2% in August. Crude steel output growth dropped to -4.6% yoy in September from -0.7% yoy in August, and smartphone output growth also eased to +0.1% yoy from +3.2% yoy.
 3. Fixed asset investment (FAI) growth remained depressed at -6.7% yoy in September (vs. -6.8% yoy in August) on a single month basis. The prolonged property downturn and the ongoing "anti-involution" policies (which should constrain manufacturing investment) remained a drag, while infrastructure investment improved sequentially (+6.4% mom sa non-annualized), reflecting better weather conditions than in July-August and an acceleration in government spending (Exhibit 3). Specifically, year-on-year growth in manufacturing, infrastructure and property investment registered at -1.8%, -8.2% and -21.1% in September, respectively, from -2.0%, -8.3% and -19.4% in August. Year-on-year contraction in “other” investment (i.e., services and agriculture-related investment) narrowed to -1.9% in September from -3.1% in August, thanks entirely to a low base.
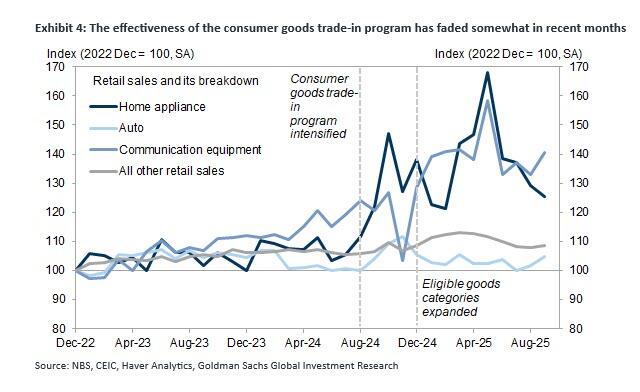
 4. Nominal retail sales growth slowed to 3.0% yoy in September from 3.4% yoy in August, mainly dragged by weaker offline goods sales and restaurant revenue sales, year-on-year growth of which declined to 1.8% and 0.9% in September from 2.3% and 2.1% in August. By comparison, online goods growth edged up to 7.3% yoy in September from 7.2% yoy in August. Year-on-year growth in home appliance sales value dropped significantly to 3.3% in September from 14.3% in August, reflecting both a high base and fading effectiveness of the ongoing consumer goods trade-in program. However, year-on-year growth in auto and communication equipment sales value rose to 1.6% and 16.2% in September, respectively, from 0.8% and 7.3% in August (Exhibit 4). On a sequential basis, we estimate retail sales value rose 0.2% mom sa non-annualized in September (vs. -0.3% mom sa non-annualized in August).
 5. Year-on-year growth in the Services Industry Output Index -- which is on a real basis and tracks tertiary GDP growth closely (57% of China's economy as of 2024) – fared better than retail sales growth and remained unchanged from August at 5.6% yoy in September. In sequential terms, the Services Industry Output Index rose 0.7% mom sa non-annualized in September (vs. +0.4% mom sa non-annualized in August).
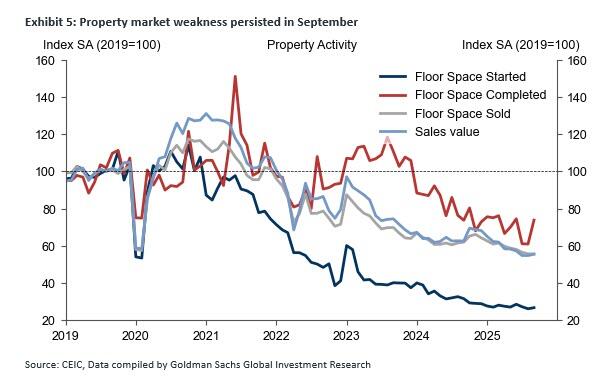
6. Property market weakness persisted in September, with year-on-year contraction in most property activity indicator . Specifically, year-on-year growth of new home starts and under construction remained depressed in September, registering -14.4% and -9.4%, respectively (vs. -20.3% and -9.3% in August), while new home completions growth improved to +1.5% yoy from -21.5% yoy. Property sales declined by 10.5% yoy in volume (floor space) terms and 11.8% yoy in value terms in September (vs. -10.3% yoy and -13.8% yoy, respectively, in August). Our high-frequency trackers suggest home transactions in large cities stayed tepid as of mid-October. Meanwhile, NBS and private sector data both showed continued downward pressure on home prices in September.
5. Year-on-year growth in the Services Industry Output Index -- which is on a real basis and tracks tertiary GDP growth closely (57% of China's economy as of 2024) – fared better than retail sales growth and remained unchanged from August at 5.6% yoy in September. In sequential terms, the Services Industry Output Index rose 0.7% mom sa non-annualized in September (vs. +0.4% mom sa non-annualized in August).
6. Property market weakness persisted in September, with year-on-year contraction in most property activity indicator . Specifically, year-on-year growth of new home starts and under construction remained depressed in September, registering -14.4% and -9.4%, respectively (vs. -20.3% and -9.3% in August), while new home completions growth improved to +1.5% yoy from -21.5% yoy. Property sales declined by 10.5% yoy in volume (floor space) terms and 11.8% yoy in value terms in September (vs. -10.3% yoy and -13.8% yoy, respectively, in August). Our high-frequency trackers suggest home transactions in large cities stayed tepid as of mid-October. Meanwhile, NBS and private sector data both showed continued downward pressure on home prices in September.
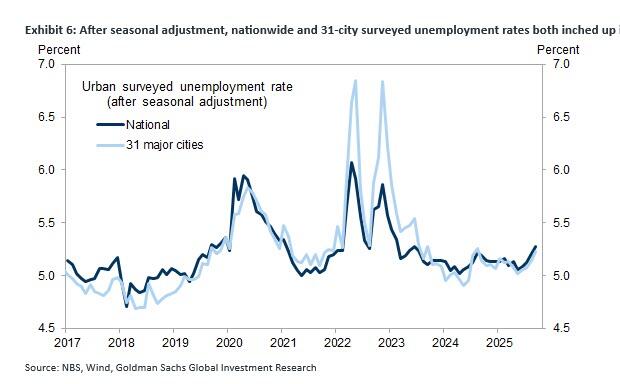
 7. Regarding the labor market, the nationwide unemployment rate and the 31-city metric (not seasonally adjusted) both inched down to 5.2% in September from 5.3% in August. After seasonal adjustment, these two unemployment rate metrics continued to rise modestly in September. The unemployment rate for migrant workers (without local Hukou) was unchanged at 5.1% from August to September after seasonal adjustments. Following the NBS definition revisions (excluding students in schools) in January 2024, the release of youth unemployment rate data has been delayed by around three days vs. general labor market statistics. The latest data available suggests the unemployment rate of the 16-24 age group edged up to 18.9% in August from 17.8% in July, marginally above its recent peak of 18.8% in last August, given the 12.2 million college graduates this year (vs. 11.8 million in 2024). Goldman expects the youth unemployment rate to decline in coming months on seasonal factors, but caution it would be higher than year-ago levels due to weak domestic demand.
 According to Goldman, despite recent developments in US-China tensions, we believe China's full-year growth target remains largely on track, given that real GDP grew 5.2% yoy during the first three quarters of this year and exports (driven by tariff frontrunning) remain resilient. Additionally, Goldman does not think policymakers see an immediate need to launch broad-based, significant stimulus in the near-term, even though incremental and targeted easing appears necessary in coming quarters to ensure stable growth and employment into next year. The majority of the growth impulse of recent easing measures -- including the nationwide childbirth subsidies, the RMB500bn policy bank new financing instrument, and the use of an RMB500bn unspent local government bond issuance quota accumulated from previous years – will likely be concentrated in late 2025 or early 2026.
That's the optimistic view. A rather more realistic one comes from Reuters which writes that Beijing may be using the headline "resilience" in growth as a show of strength in talks between its vice premier He Lifeng and Treasury Secretary Scott Bessent in Malaysia in coming days and a potential meeting between presidents Donald Trump and Xi Jinping in South Korea later.
This downbeat view is reinforced by the latest observations from Bloomberg's Econ team which overnight wrote that China's 7% investment slump shows deep demand weakness. According to a note published by BBG overnight, China’s latest data dump reassures near-term growth but underscores long-term challenges. Third-quarter GDP growth of 4.8% means the economy only needs to clear a low bar of 4.5% in 4Q to meet the 5% full-year target, helped by a surge in production.
Yet the imbalance between supply and demand has aggravated. Consumption remains weak, and investment - including public investment - has emerged as the weakest link. That's because Bloomberg Economics calculates that fixed-asset investment contracted for the fourth month in a row, by as much as 7% in September.
The same supply-demand imbalance is evident in the month-on-month comparison. Industrial production rose 0.64% — the highest in seven months and in line with the pre-pandemic trend - while retail sales fell 0.18%, the third monthly contraction in four months.
According to Goldman, despite recent developments in US-China tensions, we believe China's full-year growth target remains largely on track, given that real GDP grew 5.2% yoy during the first three quarters of this year and exports (driven by tariff frontrunning) remain resilient. Additionally, Goldman does not think policymakers see an immediate need to launch broad-based, significant stimulus in the near-term, even though incremental and targeted easing appears necessary in coming quarters to ensure stable growth and employment into next year. The majority of the growth impulse of recent easing measures -- including the nationwide childbirth subsidies, the RMB500bn policy bank new financing instrument, and the use of an RMB500bn unspent local government bond issuance quota accumulated from previous years – will likely be concentrated in late 2025 or early 2026.
That's the optimistic view. A rather more realistic one comes from Reuters which writes that Beijing may be using the headline "resilience" in growth as a show of strength in talks between its vice premier He Lifeng and Treasury Secretary Scott Bessent in Malaysia in coming days and a potential meeting between presidents Donald Trump and Xi Jinping in South Korea later.
This downbeat view is reinforced by the latest observations from Bloomberg's Econ team which overnight wrote that China's 7% investment slump shows deep demand weakness. According to a note published by BBG overnight, China’s latest data dump reassures near-term growth but underscores long-term challenges. Third-quarter GDP growth of 4.8% means the economy only needs to clear a low bar of 4.5% in 4Q to meet the 5% full-year target, helped by a surge in production.
Yet the imbalance between supply and demand has aggravated. Consumption remains weak, and investment - including public investment - has emerged as the weakest link. That's because Bloomberg Economics calculates that fixed-asset investment contracted for the fourth month in a row, by as much as 7% in September.
The same supply-demand imbalance is evident in the month-on-month comparison. Industrial production rose 0.64% — the highest in seven months and in line with the pre-pandemic trend - while retail sales fell 0.18%, the third monthly contraction in four months.
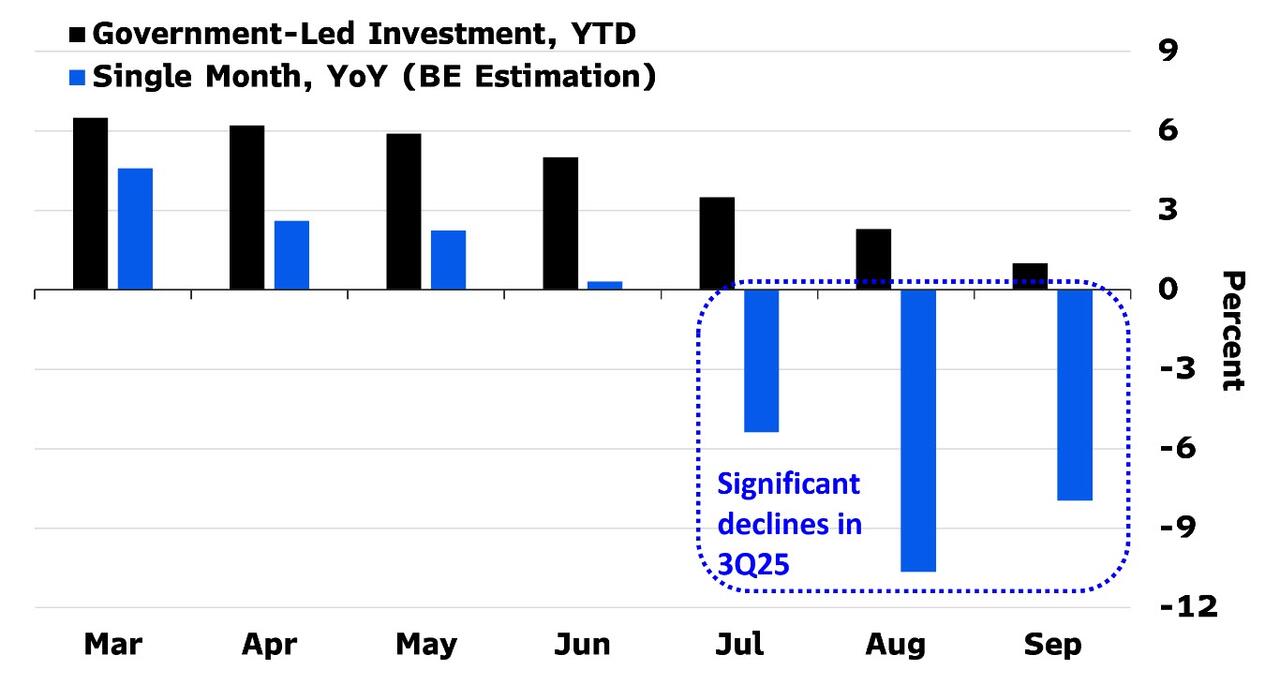
 As shown below, the collapse in fixed-asset investment has become became the biggest drag on the economy, as government-led investment lost steam. Investment has deteriorated across the board, in both the private and public sectors. The latter is particularly concerning, as government-led investment has been the primary driver of investment over the past few years. BBG calculates that government-led investment declined year-on-year through 3Q, including an 8% drop in September.
 Slowing consumption is another drag on the economy. BBG estimates that retail sales growth fell below the pre-stimulus trend for the first time in September since the government ramped up stimulus in September 2024. In September, catering revenue rose only 0.9% year on year, the same as in June — the lowest growth rate since 2023. This reflected cautious consumption of households — as they spent less on unnecessary items. In addition, home appliance sales have slowed rapidly, indicating that the boost from government subsidies is fading. Sales in September increased 3.3% from a year earlier, far lower than that in August (14.3%) or July (28.7%).
Meanwhile, the only silver lining - the ongoing export strength, which itself is a function of the trade war - belies weakness on home turf, where lacklustre demand gives manufacturers no choice but to fight price wars in foreign markets, and compromise on their profitability.
Jeremy Fang, a sales officer at a Chinese aluminium products maker, says his firm lost 20% of revenue as higher sales in Latin America, Africa, Southeast Asia, Turkey and the Middle East failed to fully offset an 80%-90% order plunge in the US. Fang said he is learning Spanish to get ahead of his Chinese competitors rushing to non-U.S. markets and is now traveling abroad twice more often than he did last year.
But that extra effort isn’t enough.
"You have to be ruthlessly competitive on price," Fang said. "If your price is $100 and the customer starts bargaining, it's better to drop $10-$20 and take the order. You can't hesitate."
This also explains why despite the surging tariffs, goods increases on US imports remains very tame.
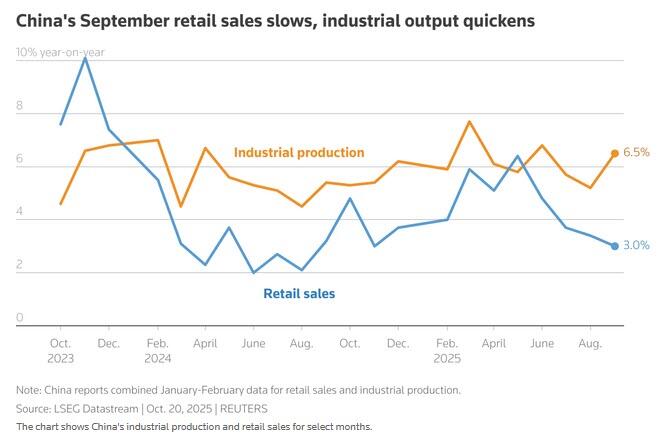
This intense competition among Chinese exporters feeds further weakness at home, with many having to cut wages and even jobs to stay in the race. As noted above, while industrial output grew to a three-month high of 6.5% year-on-year in September, beating forecasts, retail sales slowed to a 10-month low of 3.0%.
Slowing consumption is another drag on the economy. BBG estimates that retail sales growth fell below the pre-stimulus trend for the first time in September since the government ramped up stimulus in September 2024. In September, catering revenue rose only 0.9% year on year, the same as in June — the lowest growth rate since 2023. This reflected cautious consumption of households — as they spent less on unnecessary items. In addition, home appliance sales have slowed rapidly, indicating that the boost from government subsidies is fading. Sales in September increased 3.3% from a year earlier, far lower than that in August (14.3%) or July (28.7%).
Meanwhile, the only silver lining - the ongoing export strength, which itself is a function of the trade war - belies weakness on home turf, where lacklustre demand gives manufacturers no choice but to fight price wars in foreign markets, and compromise on their profitability.
Jeremy Fang, a sales officer at a Chinese aluminium products maker, says his firm lost 20% of revenue as higher sales in Latin America, Africa, Southeast Asia, Turkey and the Middle East failed to fully offset an 80%-90% order plunge in the US. Fang said he is learning Spanish to get ahead of his Chinese competitors rushing to non-U.S. markets and is now traveling abroad twice more often than he did last year.
But that extra effort isn’t enough.
"You have to be ruthlessly competitive on price," Fang said. "If your price is $100 and the customer starts bargaining, it's better to drop $10-$20 and take the order. You can't hesitate."
This also explains why despite the surging tariffs, goods increases on US imports remains very tame.
This intense competition among Chinese exporters feeds further weakness at home, with many having to cut wages and even jobs to stay in the race. As noted above, while industrial output grew to a three-month high of 6.5% year-on-year in September, beating forecasts, retail sales slowed to a 10-month low of 3.0%.
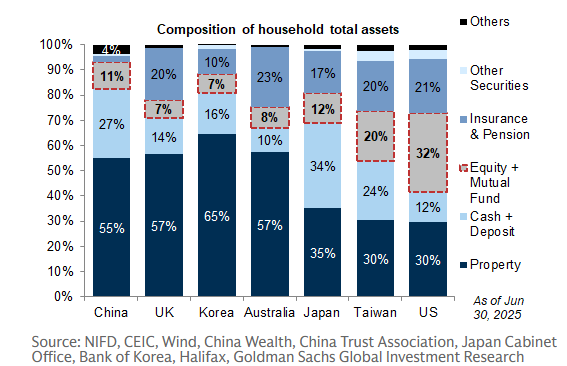
 Further hitting consumers by making them feel less wealthy, data also showed new home prices falling at their fastest pace in 11 months in September. Investment in the crisis-hit property sector fell 13.9% year-on-year in the first three quarters, which is devastating for a country where some 55% of household net worth - among the highest in the world - is found in real estate.
 "China’s growth is becoming increasingly dependent on exports, which are offsetting a slowdown in domestic demand," said Capital Economics analyst Julian Evans-Pritchard.
"This pattern of development is not sustainable, and so growth is at risk of slowing further over the medium-term unless the authorities take much more proactive steps to support consumer spending."
Such calls for structural measures that make China's economy more reliant on household consumption have grown louder ahead of this week's key Communist Party meeting, where its elites will discuss the country's next five-year development plan (see "
"China’s growth is becoming increasingly dependent on exports, which are offsetting a slowdown in domestic demand," said Capital Economics analyst Julian Evans-Pritchard.
"This pattern of development is not sustainable, and so growth is at risk of slowing further over the medium-term unless the authorities take much more proactive steps to support consumer spending."
Such calls for structural measures that make China's economy more reliant on household consumption have grown louder ahead of this week's key Communist Party meeting, where its elites will discuss the country's next five-year development plan (see " Looking ahead, Goldman writes that the divergent supply and demand trends underscore the need for the government to find effective ways to support growth, even if the economy does not require an additional boost in 4Q. The bank sees less monetary easing in 4Q, with only one possible cut in either the policy rate or the reserve requirement ratio, unlike earlier expectation of moves on both fronts. On the fiscal front, the focus will likely be on implementation and early groundwork for 2026, such as front-loading bond issuance and putting funds in place for projects. The sharp decline in government investment highlights the urgency of identifying more viable investment projects and social programs to spur consumption.
 The justices granted the petition in the United States v. Hemani without comment in an unsigned
 In an internal