
@NewsBTC
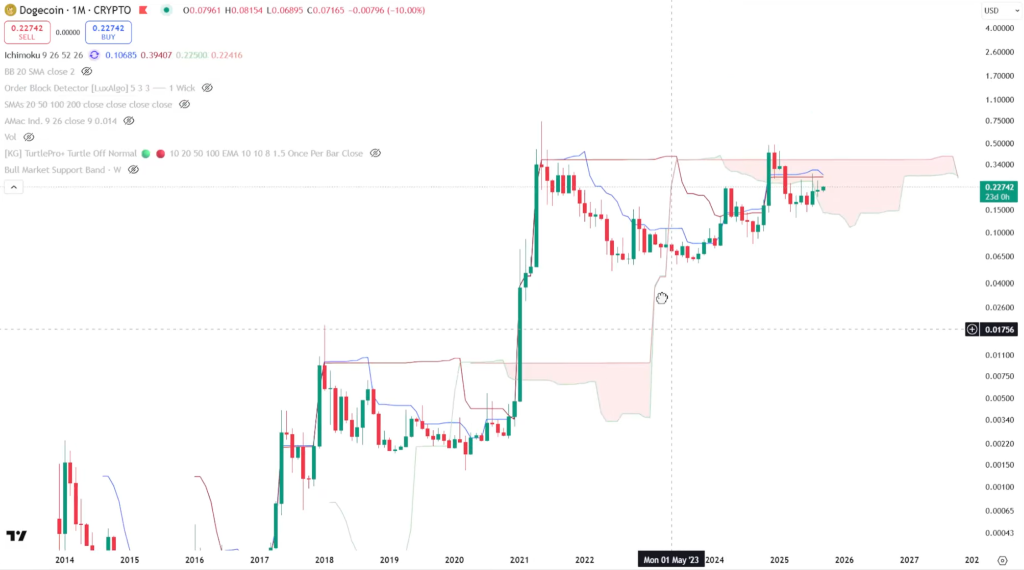 In a video analysis published today, the crypto chartist known as Cantonese Cat (@cantonmeow) laid out a multi-time-frame bullish case for Dogecoin, arguing that the asset is entering a third major cycle with technicals aligning for an upside break and multi-dollar targets—provided key resistance levels are cleared. “I’m extremely bullish on Dogecoin. I’m not going to be shy about it,” he said, adding that the current advance looks “a lot healthier than the last cycle.” Dogecoin Breakout Could Shock Bears Cantonese Cat frames the landscape first on the monthly chart, where the 20-month moving average has historically toggled from resistance to support at major inflection points. In his view, Dogecoin is now “kind of holding the 20-month moving average and taking a little bit of a stepwise approach on the way up here, forming overall higher highs and higher lows.” He also notes a quiet re-entry into the Ichimoku Cloud via consolidation rather than a blow-off impulse: “We are currently entering the Ichimoku cloud here very quietly by just going sideways. This is a break in of the cloud and this is bullish as far as I’m concerned.” Structurally, he characterizes the cycle as a classical base-building sequence. “It looks like a big giant cup with a handle,” he said, emphasizing that the handle retraced to a technically “reasonable” depth. With Fibonacci overlays applied, he observes that the pullback reached the 0.382 retracement—consistent with constructive, mid-cycle digestion—before price resumed trend. More broadly, he argues Dogecoin has been respecting Fibonacci pivots in an orderly, trend-like cadence: “Basically, you’re taking three steps forward, two steps back. This is a very healthy bull trend until proven otherwise.” Related Reading: Dogecoin Holds Support as Analysts Eye Technical Setup That Could Trigger a $2 Super Rally On the weekly timeframe, he points to the confluence of the 20-week simple moving average and the 21-week exponential moving average—the support “band” many crypto traders track—as now acting as a floor rather than a ceiling. “You also broke above the support band resistance over here and flip into support. That’s also not a bearish thing here at all,” he said. The Ichimoku baseline has, in his words, been defended “at around 20 cents… very, very well for a long time,” while the 20-week average is “curling up,” further reinforcing the view that momentum is tilting higher. He also flags a “double bottom” and a successful back-test of the breakout zone that, taken together, leave him expecting upside resolution: “I think breakout is probably imminent whenever it wants to happen.” Related Reading: First US Dogecoin ETF Could Debut Next Week—How Will It Impact Price? Cantonese Cat underscores multi-time-frame alignment as a key tell. According to his read, the 20-period moving average has been reclaimed on the daily, two-day, three-day, weekly, and monthly charts. The main near-term caveat is tactical: an “impulsive move” has pushed price “way outside the 12-hour bullish band,” which he believes explains the current pause. He also acknowledges a diagonal resistance line that may be undergoing a back-test, but does not see it as thesis-breaking. DOGE Price Targets For This Cycle When pressed by his own audience for destinations, he distinguishes between conditions and targets. He argues that last cycle’s run into a 2.272 logarithmic Fibonacci extension is unlikely to repeat verbatim. This time, he sees the 1.272, 1.414, and 1.618 extensions as more realistic markers—levels he maps to approximately “$1.50, $2.27, and maybe close to $4.” But he stresses the path-dependency: “Those are going to be the requirement for some of these higher targets to be met” only if Dogecoin can first clear the deep retracement band on this cycle. “We need to break above the 0.786 and the 0.86 this cycle,” he said, adding that “one level at a time, $0.41, $0.54, we need to break above those before we can really try to entertain some of these… greater than the dollar targets.” As for timing, he is explicit about uncertainty even as he reiterates direction. “All I can tell you is that Doge is probably ready for a big move up over the next few weeks. I don’t know when exactly that’s going to happen, but I am pretty bullish on Doge,” he said. He cautions against forcing precision on the calendar—“I never do any short-dated options… I don’t like to play with 3D chess and to be limited by time”—and instead describes a systematic accumulation strategy that has bought successive higher lows: “The market seems to keep giving me these higher lows to buy Doge at. I’m not going to say no to it.” The analytic through-line is that this cycle’s ascent is more measured than the last, with trend integrity—higher highs and higher lows, reclaimed moving averages across time frames, and cloud re-entry by drift rather than spike—offering a sturdier base for continuation. Whether that ultimately extends to “$1.50, $2.27, and maybe close to $4” will, in his framework, hinge on Dogecoin defeating the remaining retracement band and converting it to support. Until then, he concludes, the burden of proof remains on the bears: “This is not a bear trend at all.” At press time, DOGE traded at $0.231. Featured image created with DALL.E, chart from TradingView.com

In a video analysis published today, the crypto chartist known as Cantonese Cat (@cantonmeow) laid out a multi-time-frame bullish case for Dogecoin, arguing that the asset is entering a third major cycle with technicals aligning for an upside break and multi-dollar targets—provided key resistance levels are cleared. “I’m extremely bullish on Dogecoin. I’m not going to be shy about it,” he said, adding that the current advance looks “a lot healthier than the last cycle.” Dogecoin Breakout Could Shock Bears Cantonese Cat frames the landscape first on the monthly chart, where the 20-month moving average has historically toggled from resistance to support at major inflection points. In his view, Dogecoin is now “kind of holding the 20-month moving average and taking a little bit of a stepwise approach on the way up here, forming overall higher highs and higher lows.” He also notes a quiet re-entry into the Ichimoku Cloud via consolidation rather than a blow-off impulse: “We are currently entering the Ichimoku cloud here very quietly by just going sideways. This is a break in of the cloud and this is bullish as far as I’m concerned.” Structurally, he characterizes the cycle as a classical base-building sequence. “It looks like a big giant cup with a handle,” he said, emphasizing that the handle retraced to a technically “reasonable” depth. With Fibonacci overlays applied, he observes that the pullback reached the 0.382 retracement—consistent with constructive, mid-cycle digestion—before price resumed trend. More broadly, he argues Dogecoin has been respecting Fibonacci pivots in an orderly, trend-like cadence: “Basically, you’re taking three steps forward, two steps back. This is a very healthy bull trend until proven otherwise.” Related Reading: Dogecoin Holds Support as Analysts Eye Technical Setup That Could Trigger a $2 Super Rally On the weekly timeframe, he points to the confluence of the 20-week simple moving average and the 21-week exponential moving average—the support “band” many crypto traders track—as now acting as a floor rather than a ceiling. “You also broke above the support band resistance over here and flip into support. That’s also not a bearish thing here at all,” he said. The Ichimoku baseline has, in his words, been defended “at around 20 cents… very, very well for a long time,” while the 20-week average is “curling up,” further reinforcing the view that momentum is tilting higher. He also flags a “double bottom” and a successful back-test of the breakout zone that, taken together, leave him expecting upside resolution: “I think breakout is probably imminent whenever it wants to happen.” Related Reading: First US Dogecoin ETF Could Debut Next Week—How Will It Impact Price? Cantonese Cat underscores multi-time-frame alignment as a key tell. According to his read, the 20-period moving average has been reclaimed on the daily, two-day, three-day, weekly, and monthly charts. The main near-term caveat is tactical: an “impulsive move” has pushed price “way outside the 12-hour bullish band,” which he believes explains the current pause. He also acknowledges a diagonal resistance line that may be undergoing a back-test, but does not see it as thesis-breaking. DOGE Price Targets For This Cycle When pressed by his own audience for destinations, he distinguishes between conditions and targets. He argues that last cycle’s run into a 2.272 logarithmic Fibonacci extension is unlikely to repeat verbatim. This time, he sees the 1.272, 1.414, and 1.618 extensions as more realistic markers—levels he maps to approximately “$1.50, $2.27, and maybe close to $4.” But he stresses the path-dependency: “Those are going to be the requirement for some of these higher targets to be met” only if Dogecoin can first clear the deep retracement band on this cycle. “We need to break above the 0.786 and the 0.86 this cycle,” he said, adding that “one level at a time, $0.41, $0.54, we need to break above those before we can really try to entertain some of these… greater than the dollar targets.” As for timing, he is explicit about uncertainty even as he reiterates direction. “All I can tell you is that Doge is probably ready for a big move up over the next few weeks. I don’t know when exactly that’s going to happen, but I am pretty bullish on Doge,” he said. He cautions against forcing precision on the calendar—“I never do any short-dated options… I don’t like to play with 3D chess and to be limited by time”—and instead describes a systematic accumulation strategy that has bought successive higher lows: “The market seems to keep giving me these higher lows to buy Doge at. I’m not going to say no to it.” The analytic through-line is that this cycle’s ascent is more measured than the last, with trend integrity—higher highs and higher lows, reclaimed moving averages across time frames, and cloud re-entry by drift rather than spike—offering a sturdier base for continuation. Whether that ultimately extends to “$1.50, $2.27, and maybe close to $4” will, in his framework, hinge on Dogecoin defeating the remaining retracement band and converting it to support. Until then, he concludes, the burden of proof remains on the bears: “This is not a bear trend at all.” At press time, DOGE traded at $0.231. Featured image created with DALL.E, chart from TradingView.com
NewsBTC
Dogecoin Mega Rally Ahead? Crypto Analyst Says $4 Is In Play
Crypto chartist Cantonese Cat lays out a multi-time-frame bullish case for Dogecoin, arguing that the asset is entering a third major cycle.
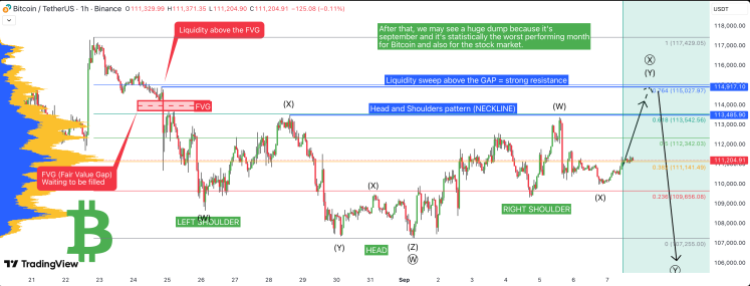 The Bitcoin price chart is now flashing a head and shoulders pattern with quite a clear plan for what could be coming next. Mix in the fact that there is an unfilled Fair Value Gap (FVG) available for the time being, with a high probability of being filled. This makes for a good idea for how the Bitcoin price could play out in the new week. However, there is also the possibility of a crash with resistance mounting that could cause trouble for the cryptocurrency. Filling The Fair Value Gap At $114,000 Crypto analyst Xanrox revealed that the first Bitcoin Fair Value Gap (FVG) opened up right above $114,000 following the last crash. This gap left a hole for liquidity that could attract more buy-ins to trigger another run. This fair value gap is also sitting above the Head and Shoulders pattern that has formed on the chart. Related Reading: Analyst Forecasts XRP To Stage Amazon-Like Rally To $200 With the gap still open and more likely to be filled, it suggests that the Bitcoin price could see a first initial run-up from here. This would take it all the way up to $114,000, and this is where the real problem comes in. This is because there is a lot of resistance building up above the fair value gap that could be triggered once the liquidity is sucked dry. Xanrox further explains that many traders have placed their stop loss orders above $114,000, which also adds to the mounting pressure at this level. Thus, whales will use this opportunity to take out all of the liquidity before they start to push the Bitcoin price back down. Bitcoin Price On The Edge Of A Crash Once the fair value gap is filled at $114,000, then there is the next phase of the trend, which is more bearish. In the post, the crypto analyst predicts that the price will begin another dump. This will be triggered by the lack of liquidity and the completion of the Head and Shoulders pattern. Related Reading: Ethereum Exchange Balance Turns Negative For The First Time – Why This Is Bullish For Price The crash is expected to go deeper than the current local low from August, plummeting below the support at $108,000. The more than 10% crash after filling the fair value gap is expected to push Bitcoin back down as low as $106,000 before finding a bottom. Xanrox expects all of this to play out this month, citing multiple factors for this. “We may see a huge dump because it’s September and it’s statistically the worst performing month for Bitcoin and also for the stock market,” the analyst stated. Featured image from Dall.E, chart from TradingView.com

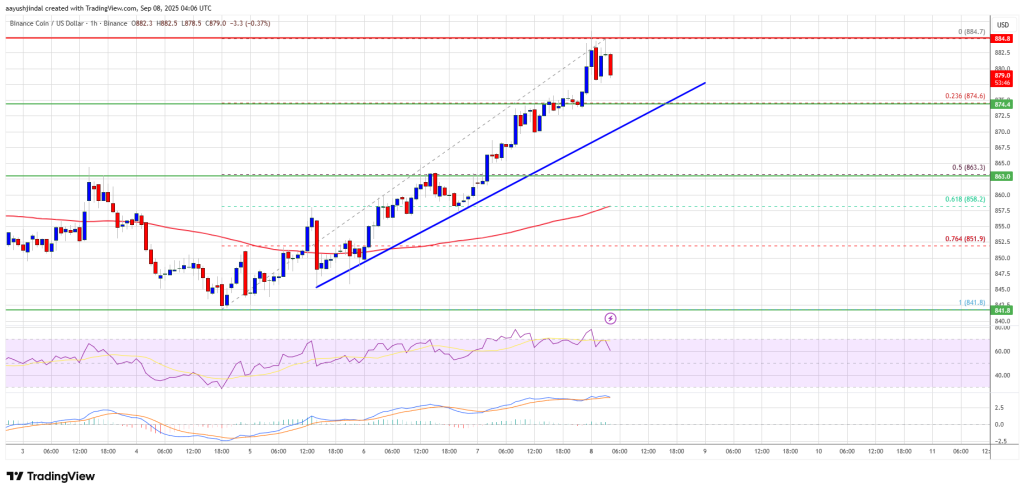 BNB price is gaining pace above the $865 zone. The price is now showing positive signs and might aim for a move above the $900 handle in the near term. BNB price started a fresh increase above the $850 and $865 levels. The price is now trading above $870 and the 100-hourly simple moving average. There is a key bullish trend line forming with support at $874 on the hourly chart of the BNB/USD pair (data source from Binance). The pair must stay above the $870 level to start another increase in the near term. BNB Price Regains Strength BNB price formed a base above the $840 level and started a fresh increase, beating Ethereum and Bitcoin. There was a steady move above the $850 and $865 levels. The bulls even cleared the $875 resistance zone. A high was formed at $884 and the price is now consolidating gains. It is well above the 23.6% Fib retracement level of the upward move from the $841 swing low to the $884 high. The price is now trading above $875 and the 100-hourly simple moving average. Besides, there is a key bullish trend line forming with support at $874 on the hourly chart of the BNB/USD pair. On the upside, the price could face resistance near the $882 level. The next resistance sits near the $885 level. A clear move above the $885 zone could send the price higher. In the stated case, BNB price could test $892. A close above the $892 resistance might set the pace for a larger move toward the $900 resistance. Any more gains might call for a test of the $920 level in the near term. Another Pullback? If BNB fails to clear the $885 resistance, it could start another decline. Initial support on the downside is near the $875 level. The next major support is near the $865 level or the 50% Fib retracement level of the upward move from the $841 swing low to the $884 high. The main support sits at $855. If there is a downside break below the $855 support, the price could drop toward the $872 support. Any more losses could initiate a larger decline toward the $835 level. Technical Indicators Hourly MACD – The MACD for BNB/USD is losing pace in the bullish zone. Hourly RSI (Relative Strength Index) – The RSI for BNB/USD is currently above the 50 level. Major Support Levels – $875 and $865. Major Resistance Levels – $885 and $900.

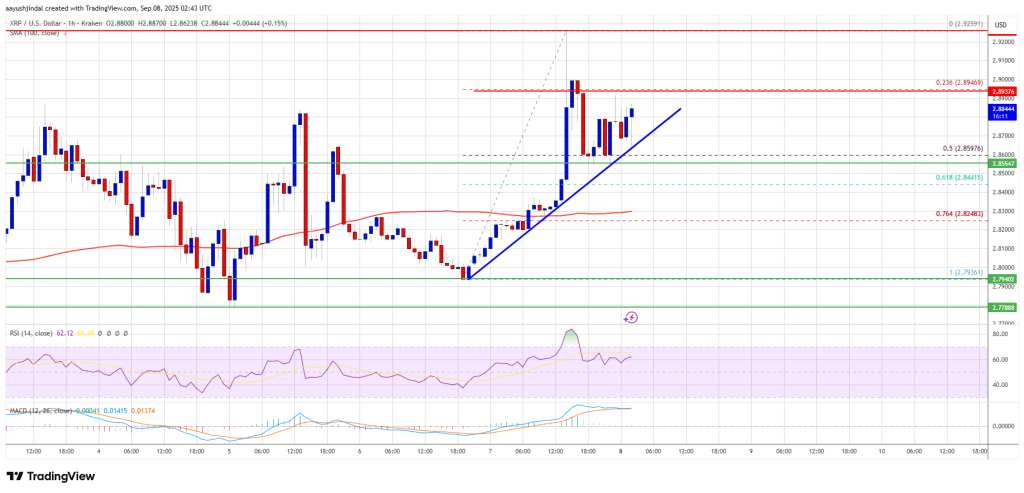 XRP price is struggling to recover above the $2.920 zone. The price is now moving higher and might gain pace if it settles above $2.90. XRP price is facing hurdles and struggling to recover above the $2.920 resistance. The price is now trading above $2.850 and the 100-hourly Simple Moving Average. There is a bullish trend line forming with support at $2.8650 on the hourly chart of the XRP/USD pair (data source from Kraken). The pair could continue to rise if it stays above the $2.850 zone. XRP Price Eyes Upside Break XRP price managed to stay above the $2.80 level and started a recovery wave, like Bitcoin and Ethereum. The price climbed above the $2.8350 and $2.850 resistance levels. However, the price seems to be struggling to settle above the $2.920 resistance zone. Recently, there was a fresh bearish reaction below the $2.90 level. The price dipped below the 23.6% Fib retracement level of the upward move from the $2.793 swing low to the $2.925 high. The price is now trading above $2.850 and the 100-hourly Simple Moving Average. Besides, there is a bullish trend line forming with support at $2.8650 on the hourly chart of the XRP/USD pair. If the bulls protect the $2.850 support, the price could attempt another increase. On the upside, the price might face resistance near the $2.90 level. The first major resistance is near the $2.920 level. A clear move above the $2.920 resistance might send the price toward the $2.980 resistance. Any more gains might send the price toward the $3.00 resistance. The next major hurdle for the bulls might be near $3.050. Another Decline? If XRP fails to clear the $2.920 resistance zone, it could continue to move down. Initial support on the downside is near the $2.8650 level and trend line. The next major support is near the $2.850 level or the 50% Fib retracement level of the upward move from the $2.793 swing low to the $2.925 high. If there is a downside break and a close below the $2.850 level, the price might continue to decline toward $2.80. The next major support sits near the $2.720 zone, below which the price could gain bearish momentum. Technical Indicators Hourly MACD – The MACD for XRP/USD is now gaining pace in the bullish zone. Hourly RSI (Relative Strength Index) – The RSI for XRP/USD is now above the 50 level. Major Support Levels – $2.850 and $2.80. Major Resistance Levels – $2.90 and $2.920.


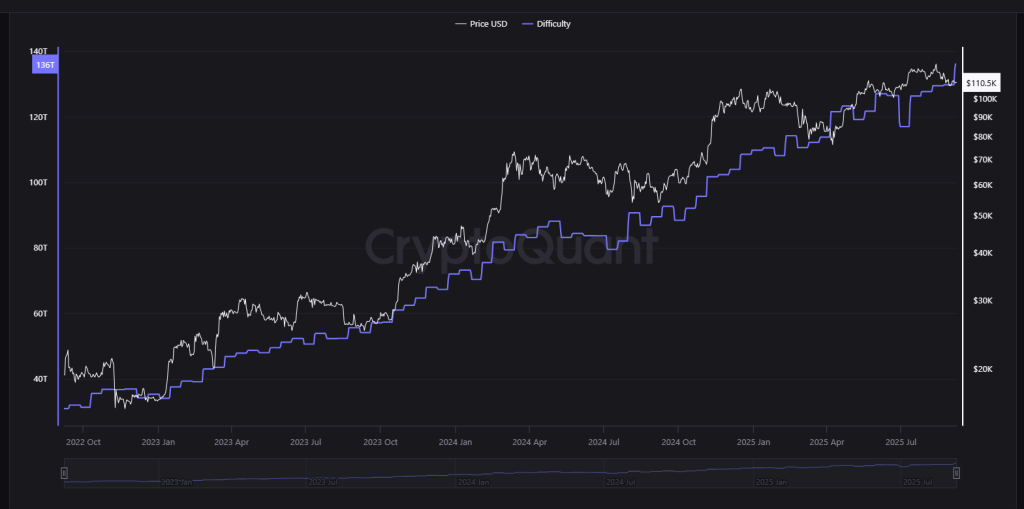 Bitcoin’s mining math hit a fresh high this week as the network’s difficulty climbed to a new all-time peak of 135 trillion. Miners now need more computing work than ever to win a block, while the overall hashpower available to the network has slipped from its summer peak. Related Reading: MemeCore Explodes 3,800% For ATH — But Is A Collapse Around The Corner? Mining Difficulty Reaches New High According to on-chain data, network hashrate fell to 967 billion hashes per second after topping 1 trillion hashes per second on August 4. That gap — rising difficulty paired with a lower hashrate — tightens margins for miners. Reports have disclosed that higher difficulty makes mining more costly, and the pressure is felt most by smaller operations that run on narrow profit margins. Big miners have room to scale. Smaller teams do not. Costs for electricity, machines and maintenance add up fast. The situation raises concern about concentration. As the cost to operate rises, larger pools and firms are better positioned to absorb the pain and keep hashing. Solo Miners Still Score Big Despite those headwinds, Three solo miners managed to land blocks in July and August, proving the system still hands out rewards to individuals now and then. Reports show the block subsidy is 3.125 BTC per block. On July three, a solo miner found block 903,883 and took home just under $350,000 in subsidy plus fees. Another solo miner added block 907,283 on July 26, claiming over $373,000 when prices at the time were used to value the reward. On August 17, block 910,440 was mined by a solo operator, yielding roughly $373,000 in subsidy and fees. Those payouts highlight two facts. First, solo success is rare but possible. Second, occasional large rewards do not erase the steady advantage of scale. Pools still smooth earnings for participants, and many miners use them to avoid long dry spells. Seasonality And Market Patterns Meanwhile, September has a poor historical record for Bitcoin, with an average return of -3.77% across 12 years beginning in 2013, researchers say. Bitcoin endured six straight losing Septembers from 2017 through 2022. The streak reversed in 2023, and 2024 closed out as the best September on record at +7.29%. Related Reading: Trump-Tied Thumzup Raises $50M, Merges Dogecoin Mining With XRP Plans What This Means Now In short, the network’s math is becoming tougher at the same time mining capacity dipped slightly. That creates tighter margins and fuels debate over centralization as scale matters more. Yet the ecosystem still shows variety: solo miners can and do win blocks, and market history gives investors a mixed picture where seasonal trends matter but do not guarantee outcomes. For now, miners and market watchers alike will be tracking difficulty, hashrate and price swings as the fall unfolds. Featured image from Unsplash, chart from TradingView


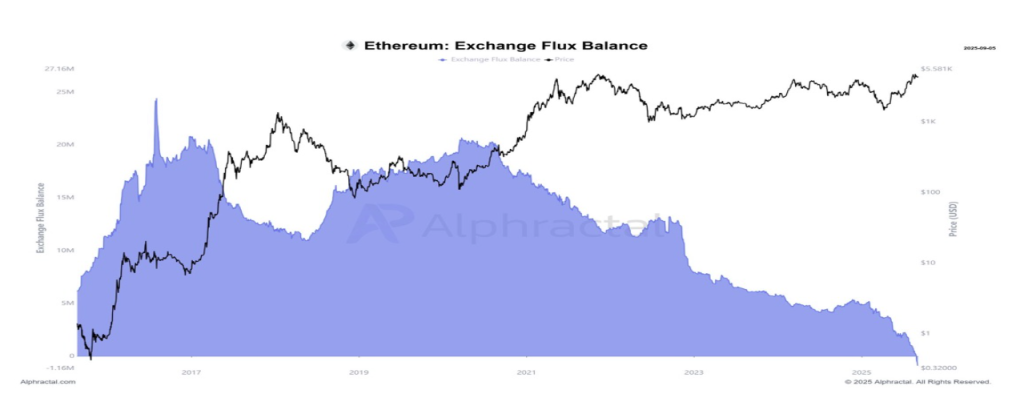 Ethereum (ETH) has just made history with a development that could reshape its market trajectory. For the first time, the Ethereum exchange balance has turned negative, meaning more tokens are being withdrawn from trading platforms than deposited. This structural shift in supply dynamics has analysts labeling it a key bullish signal for the market’s next rally. Ethereum Exchange Balance = Negative Crypto market expert Cas Abbe shared a new report showing that Ethereum’s exchange flux has slipped into the negative territory for the first time on record. He suggests that the latest development could be bullish for ETH, as it signals reduced selling pressure and growing investor confidence. Related Reading: MemeCore Explodes 3,800% For ATH — But Is A Collapse Around The Corner? Historically, the exchange balance metric has served as one of the clearest indicators of investor behavior. When balances rise, it typically signals mounting selling pressure, as traders move coins for liquidation purposes. Conversely, when they fall, it indicates that coins are being withdrawn into private wallets, which are less likely to be sold. The analyst’s chart illustrates a sharp and accelerating drop in Ethereum’s exchange balances over the past few years, culminating in this historic low. Billions worth of ETH have been removed from centralized platforms, coinciding with the asset’s advance toward a target above $5,500. This indicates a clear reduction in liquid supply during already heightened demand. According to Abbe, the importance of this decline cannot be overstated. He noted that market tops in crypto generally occur after inflows spike back into these centralized platforms, not when balances are draining to new lows. In other words, Ethereum may not be positioned for a sell-off but for accumulation. As selling pressure subsides, long-term holders exert greater control over supply, creating conditions for potentially strong upward price momentum. If history is any guide, Abbe suggests that the shrinking exchange balance could set the stage for Ethereum’s next leg up. Analyst Sets $7,000 As ETH’s Next Target While Ethereum’s exchange supply hits uncharted lows, technical analysts like Crypto Goos are increasingly bullish on its price. The market expert announced in a post on X that ETH has officially broken out of a long-term wedge pattern, which has constrained price action since 2021. The accompanying chart illustrates ETH finally piercing through resistance after years of sideways trading. Crypto Goos points to the breakout level around $3,600, and with Ethereum now trading significantly above it, the move appears confirmed. Related Reading: XRP Poised For Amazon-Like Boom? Analyst Predicts $200 Rally Although Ethereum has experienced a number of price swings in the past few weeks, Crypto Goos remains confident that it can reach a new all-time high soon. The analyst’s projection from the wedge breakout targets the $7,000 region, representing a potential upside of about 62% from current price levels above $4,300. Should momentum persist, the cryptocurrency could extend even beyond the $7,000 milestone. Featured image from Unsplash, chart from TradingView