@NewsBTC
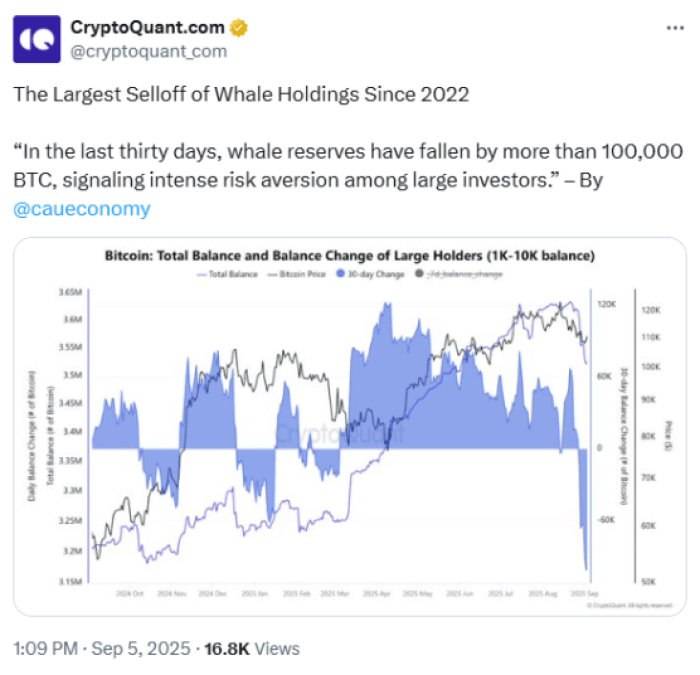
CryptoQuant analyst ‘caueconomy’ found that Bitcoin whales have dumped roughly $12.7B worth of $BTC over the past month. Shockingly, this marks the largest whale sell-offs since July 2022. These $BTC liquidations are anticipated to keep the #1 crypto’s price under pressure for longer – especially if they’re ongoing. Don’t want to sit in the dip while waiting for the market to perk back up? Then why not check out the best crypto presales? Bitcoin Whale Reserves Down 10K+ $BTC in One Month In a blog post on Friday, ‘caueconomy’ highlighted that holders are offloading $BTC more aggressively. So much so that the #1 crypto has reached its highest distribution levels this year. The analyst found that whale reserves have dropped by over 10K $BTC in the past 30 days, ‘signaling intense risk aversion among large investors.’ They believe that this selling pressure is what’s been pushing $BTC’s price below $108K, a level it had sunk below last week. At the time of writing, $BTC is valued at $111K. If you don’t want to wait for it to rebound yet want to boost your portfolio, now signals a great time to check out top presales. Since these tokens are still in their fundraising stages and not yet trading on the open market, whale sell-offs don’t affect their prices. In turn, they’re safer investment opportunities to check out in today’s volatile market. Even better, some presale coins are built with utility to help you thrive amid unfavorable market conditions, including Snorter Token ($SNORT), BlockchainFX ($BFX), and Best Wallet Token ($BEST). 1. Snorter Token ($SNORT) – Five-Figure Whale Investments Signal Confidence in Its Upcoming Trading Bot Snorter Token ($SNORT) is quickly attracting notable attention. It has already scooped up $3.7M+ on presale, propelled by three major whales investing $40K, $32K, and $21K. Such foremost transactions highlight that big investors have faith in Snorter Bot, the crypto project’s upcoming Telegram trading bot. Once launched this quarter, Snorter Bot will enable you to swap and automatically snipe new tokens quickly and safely. With an aardvark mascot, its ultimate ambition is to help you sniff out the next crypto to explode. If you’re not a confident trader, Snorter Bot’s copy trading feature has your back. It’ll enable you to mirror top traders’ moves for greater profit potential effortlessly. Better yet, it brings trust to the presale market that, unfortunately, isn’t scam-proof. Built with MEV protection, plus honeypot and rug pull alerts, the bot ensures you stay safe while chasing top opportunities for gains. It’ll first launch on Solana to take advantage of its low fees (just 0.85%) and fast transaction speeds (currently averaging 821.8 transactions per second). By doing so, it claims that it’ll outpace rival bots like Maestro, Trojan, Banana Gun, Bonk Bot, and Sol Trading Bot. Once it has a foothold in the Solana arena, the bot will expand across multiple chains, including Ethereum, BNB Chain, and other EVM networks. This way, you can trade the hottest alpha across chains – not just the best Solana meme coins. After buying $SNORT on presale, you can also anticipate leaderboard perks, DAO voting rights, and staking rewards at a 123% APY. One $SNORT currently costs as little as $0.1037. Following early bot adoption and exchange listings, it’s projected to reach $1.02. So, now presents an opportune moment to join the presale for potential returns of over 883%. 2. BlockchainFX ($BFX) – Powers Global Exchange That Bridges DeFi & TradFi $BFX is the linchpin of BlockchainFX, a cutting-edge global exchange that bridges DeFi and TradFi. Owing to this, it has nearly raised on eye-boggling $7M on presale. From a highly user-friendly app, you can gain access to not just crypto but also stocks, forex, ETFs, commodities, and bonds. Essentially, it gives you easy access to the world’s top markets, all under one roof. Although $BFX is still on presale, BlockchainFX already grants access to over 500 assets, including $BTC, $ETH, gold, and Tesla. Purchasing $BFX gives you early access to the platform, reduced trading fees, and daily staking rewards (in $USDT and $BFX). It also gives you exclusive perks like access to the limited-edition BFX Visa Card, which can be topped up with 20+ cryptos to spend globally online or in-store. This way, you can easily spend your crypto without the hassle of off-ramps. To reap these perks, you can purchase $BFX on presale for just $0.022. With a launch price set at $0.05, now’s a great time to secure early entry at its lowest current price. 3. Best Wallet Token ($BEST) – Raises $15.6M+ Over Fueling Crypto Wallet Perks Best Wallet Token ($BEST) has already attracted over $15.6M on presale as it’s the native token of Best Wallet, a mobile-friendly crypto wallet. After downloading the mobile app, you can manage, buy, sell, swap, and stake over 1K digital assets across major chains, including Ethereum, Polygon, and BNB Chain. It’ll soon support over 60 networks, so you can anticipate unlocking even greater crypto opportunities in the near future. As a non-custodial wallet, you can rest easy knowing that you have full ownership of your private keys. Considering that private key compromises accounted for the largest share of stolen crypto last year, at 43.8%, non-custodial wallets like Best Wallet are safe choices. To further ensure access to your digital assets is secure, it includes 2FA, biometric protection, local encryption, and personal cloud backups. Beyond this, the wallet is full of intuitive tools for discovering top investment opportunities at reasonable prices. This includes a token launchpad and a swap function that scans 330+ DEXs and 30 bridges for the best rates. It also has an ambitious roadmap that includes a crypto debit card (Best Card), a built-in NFT gallery, and a rewards hub for loyal users. And that’s to name a few. When buying $BEST, you’ll also be granted with lower gas fees, governance rights, and staking rewards (currently at an 85% APY). You can buy $BEST on presale for just $0.025605. But don’t wait around: Its price will increase later today and is forecasted to hit $0.035215 after being listed on Uniswap, one of the best decentralized exchanges. Verdict – The Best Crypto Presales Are Safe Investment Opportunities Bitcoin Whales offloading 100K+ $BTC shows that not even the world’s largest crypto is protected from sudden supply shocks. If you don’t want to wait for the volatility to clear up, your current best bet might be investing in the best crypto presales, like $SNORT, $BFX, and $BEST. Because they’re not yet listed on the market, they’re protected from whale-driven price swings. Plus, their utility helps you explore the next crypto to explode safely and hassle-free. This isn’t investment advice. Always do your own research and never invest more than you’d be sad to lose.

NewsBTC
The Best Crypto Presales Stand Strong Despite Bitcoin Whales Dumping $12.7B BTC Last Month
Bitcoin whales have offloaded roughly $12.7B this past month alone, making now a good time to invest in the best crypto presales.

 The Solana price has shown encouraging signs of recovery, climbing 6% on Friday to approach the $126 mark. This uptick follows a concerning dip below the crucial $120 level, which had sparked fears of a potential downtrend that could drag the cryptocurrency down toward the $100 threshold. Solana Price Gains Ground Chris MacDonald, an analyst at The Motley Fool, recently highlighted two key factors contributing to Solana’s resurgence. One significant catalyst is a proactive initiative by the Solana Foundation. Bitcoinist reported earlier this week that the organization is currently assessing whether its network can withstand potential threats from quantum computing technologies. Related Reading: Bitwise’s 2026 Crypto Forecast: Bitcoin, Ethereum, And Solana Poised For New Record Highs In collaboration with Project Eleven, a security firm specializing in post-quantum cryptography, the Solana team has launched a quantum-resistant testnet following a comprehensive threat assessment. The second notable factor driving the Solana price uptick is the announcement from health and wellness company Mangoceuticals, which revealed plans to allocate $100 million toward acquiring and holding SOL. Despite the positive momentum, experts caution that Solana’s price is currently following a “clean corrective structure.” Moving Averages Signal Downtrend From a technical analysis perspective, the 50-day simple moving average (SMA) is situated around $143, significantly higher than the current trading range, while the 200-day SMA looms even further at approximately $170, suggesting a prevailing downtrend rather than a healthy consolidation phase. In the short term, the 20-day exponential moving average has also rolled over near $133 and has consistently rejected previous attempts at a bounce. Analysts note that until the Solana price can close above the low-$130s for an extended period, any rebounds will likely be seen merely as counter-trend movements. Immediate support lies just below current trading levels at the $125 mark, followed by critical levels in the $121–$120 range, and another demand zone around $110. A more significant downturn could push the price into the high $90s, with projections indicating a potential dip to around $80 if liquidations accelerate further, as NewsBTC reported on Thursday. Related Reading: Crypto Payments Firm MoonPay Set For $5 Billion Valuation With NYSE Owner’s Backing The market has already registered an eight-month low near $116.9. A decisive close beneath that level could likely drag the Solana price toward the psychologically significant $100 mark. On the upside, the Solana price could encounter initial resistance clustered in the $133–$138 range, with stronger resistance observed in higher levels between $144 and $147 that could prevent any new recoveries in the short-term. To facilitate further price recovery, the Solana price will need to clear that second group of resistance levels on a daily close, ideally supported by increased trading volume, to pave the way toward prices between $160 and $165. Featured image from DALL-E, chart from TradingView.com


 CryptoQuant has released a new report, highlighting a significant shift in Ethereum’s exchange supply dynamics and institutional behavior. According to the data, the amount of ETH held on crypto exchanges has crashed to unexpected lows. The decline coincides with growing institutional accumulation, a trend often viewed as an early signal of a bullish price outlook. Ethereum Exchange Balances Fall To 2016 Lows Arab Chain, a crypto analyst on CryptoQuant, revealed that Ethereum’s exchange supply ratio across all tracked platforms has declined to approximately 0.137. According to the data referenced in the report, this represents one of the lowest readings observed since 2016. Related Reading: Ethereum 2-Year Trend Maps Out This Unique Crash Path To Bottom At $2,187 The analyst emphasized that this metric reflects the proportion of total ETH supply currently held on exchanges relative to the overall circulating supply. Lower levels of this metric reflect a smaller fraction of ETH ready for liquidation on exchanges, which the analyst identifies as an important factor in understanding market liquidity conditions. Arab Chain also noted that the sustained decline in this ratio indicates a continued outflow of ETH from centralized exchanges to external wallets. This movement suggests that a smaller portion of Ethereum’s supply is readily available for trading. It also signals growing confidence among holders who prefer long-term positioning over short-term speculation. From a broader market perspective, a shrinking exchange supply is often seen as bullish for prices due to basic supply-and-demand dynamics. When fewer coins are available to sell, even a slight increase in demand can push prices up, as buyers compete for a smaller pool of liquid ETH. Reduced liquidity can also limit the intensity of declines, as large sell orders become harder to execute without moving the market. In his report, Arab Chain references historical behaviour, illustrated by a chart showing the Ethereum supply ratio for all exchanges. The analyst noted that similar declines in exchange supply have occurred during periods of reaccumulation or in the lead-up to stable price movements following significant market volatility. Ethereum Supply On Binance Crashes Arab Chain has also shared insights on Ethereum’s supply on Binance. The analyst disclosed that ETH balances on the exchange have been steadily declining over the past few months. As one of the largest crypto exchanges in the world, Binance’s reserve changes often reflect broader market sentiment. Related Reading: Why Did The Bitcoin, Ethereum, And XRP Prices Crash, And Will It Continue? The CryptoQuant report highlights that the Exchange Supply Ratio on Binance has crashed to 0.0325, a relatively low level compared to previous months. This indicates a steady withdrawal of ETH from the crypto exchange, reducing the amount of tokens available for immediate spot market selling. Arab Chain suggested that the drop in Ethereum supply on Binance shows that traders are becoming more cautious. Rather than engaging in short-term trades, many appear to be holding ETH off exchanges due to ongoing market volatility and uncertainty. The analyst added that the falling supply, combined with ETH’s price stability, indicates lower selling pressure. It also signals that the market may be entering a new phase of liquidity absorption and repositioning. Featured image from Adobe Stock, chart from Tradingview.com

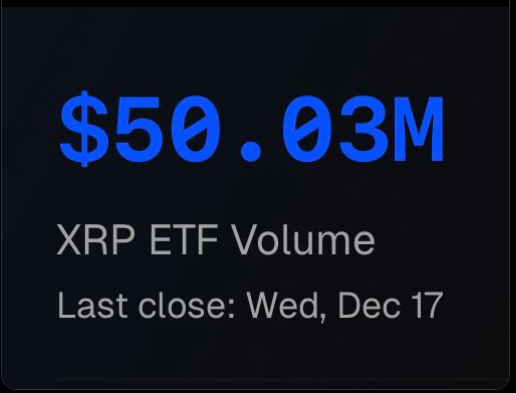 XRP-linked exchange-traded funds reached about $60 million in assets under management on December 17, according to market reports, even as XRP’s spot price slid. Related Reading: 5,606 Bitcoin: Lightning Network Sets Fresh Capacity Record At the time of reporting, XRP was trading around $1.86, down more than 8% in the last week. That gap between ETF growth and a falling spot price has left some investors puzzled. ETF Flows And How They Work According to Chad Steingraber, the way ETFs operate helps explain the disconnect. ETF shares trade on exchanges like regular stocks during market hours. Fund managers then tally net flows at the end of the trading day and arrange purchases of the underlying XRP after the market closes. Because of that timing, ETF inflows do not always translate into instant buying pressure on the spot market. Officially crossed $60Million! Record day!

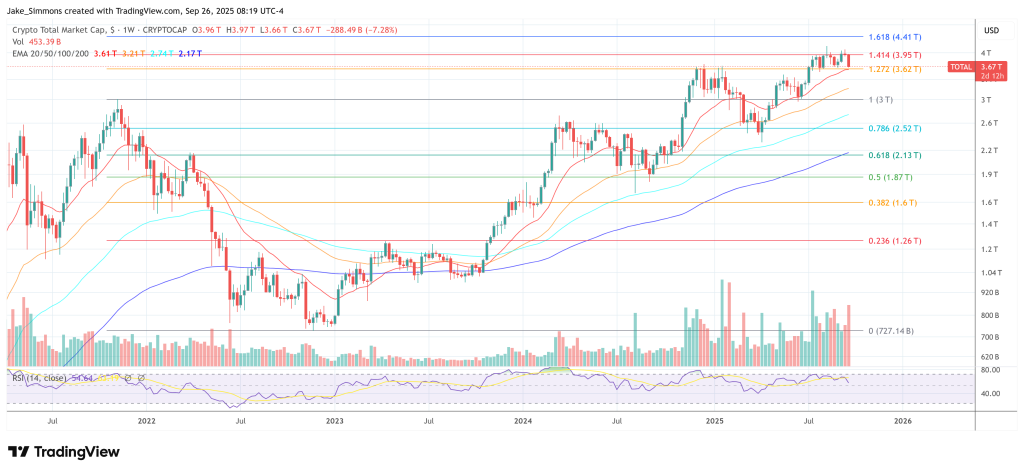 Raoul Pal believes the crypto cycle is not nearing a peak but entering a longer, more powerful expansion that can run well into 2026, driven by a global liquidity uptrend tied to government debt dynamics. In a special Sept. 25 “Everything Code” masterclass with Global Macro Investor (GMI) head of macro research Julien Bittel, the Real Vision co-founder laid out a tightly interlocked framework connecting demographics, debt, liquidity and the business cycle to asset returns—arguing that crypto and tech remain the only asset classes structurally capable of outpacing what he calls the hidden debasement of fiat. Everything Code: Liquidity Is Crypto’s Master Switch “The biggest macro variable of all time,” Pal said, “is that global governments and central banks are increasing liquidity to manage debt at 8% a year.” He separated that ongoing debasement from measured inflation, warning investors to think in hurdle rates, not headlines: “You’ve got an 11% hurdle rate on any investment that you have. If your investments are not hitting 11% you are getting poorer.” Pal and Bittel’s “Everything Code” starts with trend GDP as the sum of population growth, productivity and debt growth. With working-age populations declining and productivity subdued, public debt has filled the gap—structurally lifting debt-to-GDP and hard-wiring the need for liquidity. “Demographics are destiny,” Pal said, pointing to a falling labor-force participation rate that, in GMI’s work, mirrors the inexorable rise in government debt as a share of GDP. The bridge between the two, they argue, is the liquidity toolkit—balance sheets, the Treasury General Account (TGA), reverse repos and banking-system channels—deployed in cycles to finance interest costs that the economy cannot organically bear. “If trend growth is ~2% and rates are 4%, that gap has to be monetized,” Pal said. “It’s a story as old as the hills.” Related Reading: All-Time Highs For Gold, S&P500; Crypto Stands Alone In The Red – What’s The Root Cause? Bittel then mapped what he called the “dominoes.” GMI’s Financial Conditions Index—an econometric blend of commodities, the dollar and rates—leads total liquidity by roughly three months; total liquidity leads the ISM manufacturing index by about six months; and the ISM, in turn, sets the tone for earnings, cyclicals and crypto beta. “Our job is to live in the future,” Bittel said. “Financial conditions lead the ISM by nine months. Liquidity leads by six. That sequence is what risk markets actually trade.” In that sequence, crypto is not an outlier but a high-beta macro asset. “Bitcoin is the ISM,” Bittel said, noting that the same diffusion-index dynamics that govern small-cap equities, cyclicals, crude and emerging markets also map onto BTC and ETH. As the cycle accelerates from sub-50 ISM toward the high-50s, risk appetite migrates down the curve: first from BTC into ETH, then into large alternative L1s and, only later, into smaller caps—coinciding with falling BTC dominance. Pal cautioned investors who expect “instant altseason” that they are fighting the phasing of the real economy: “It always goes into the next safest asset first… only when the ISM is really pushing higher and dominance is falling hard do you get the rest.” Part of the recent “sideways chop,” they argued, reflected a sharp TGA rebuild—an exogenous liquidity drain that disproportionately impacts the far end of the risk curve. Bittel highlighted that the $500 billion rate of change since mid-July effectively removed fuel that otherwise would have buoyed crypto prices, while stressing that the drain is nearing an inflection. He also flagged DeMark timing signals pointing to a reversal in the TGA’s contribution to net liquidity. “That should now reverse and work lower into year-end, which then will drive our liquidity composites higher,” he said, adding that the People’s Bank of China’s balance sheet at all-time highs has partially offset US drags. Against that backdrop, the pair contend that the forthcoming 12 months are critical. “We’ve got $9 trillion of debt to roll over the next 12 months,” Pal said. “This is the 12 months where maximum money printing comes.” Their base case has policy rates moving lower into a still-subdued but improving cycle, with central banks focused on lagging mandates—unemployment and core services inflation—while early-cycle inflation breadth remains contained. Bittel underscored the sequencing inside inflation itself: commodities first, then goods, with shelter disinflation mechanically lagging, giving central banks cover to cut even as growth accelerates. The implication for portfolio construction, Pal argued, is radical. “Diversification is dead. The best thing is hyper-concentration,” he said, framing the choice not as a taste for volatility but as arithmetic survival against debasement. In GMI’s long-horizon tables, most traditional assets underperform the combined debasement-plus-inflation hurdle, while the Nasdaq earns excess returns over liquidity and Bitcoin dwarfs both. “What is the point of owning any other asset?” Pal asked rhetorically. “This is the super-massive black hole of assets, which is why we personally are all-in on crypto… It’s the greatest macro trade of all time.” Related Reading: Crypto Bloodbath Shakes Market—But Is The Real Storm Still To Come? Bittel overlaid Bitcoin’s log-regression channel—what Pal called the “network adoption rails”—on the ISM to illustrate how time and cycle amplitude interact. Because adoption drifts price targets higher through time, longer cycles mechanically point to higher potential outcomes. He showed illustrative channel levels tied to hypothetical ISM prints to explain the mechanism, from mid-$200Ks if the ISM rises into the low-50s to materially higher if the cycle extends toward the low-60s. The numbers were not presented as forecasts but as a map for how cycle strength translates into range-bound fair value bands. Macro Liquidity Extends The Crypto Bull Run Critically, Pal and Bittel argued the current cycle differs from 2020–2021, when both liquidity and the ISM peaked in March 2021, truncating the run. Today, they say, liquidity is re-accelerating into the debt-refinancing window and the ISM is still below 50 with forward indicators pointing up, setting up a 2017-style Q4 impulse with seasonal tailwinds—and, unlike 2017, a higher probability that strength spills into 2026 because the refinancing cycle itself has lengthened. “It is extremely unlikely that it tops this year,” Pal said. “The ISM just isn’t there, and global liquidity isn’t either.” The framework also locates crypto within a broader secular S-curve. Pal contrasted fiat debasement, which lifts asset prices, with GDP-anchored earnings and wages, which lag—explaining why traditional valuation optics look stretched and why owning long-duration, network-effect assets becomes existential. He placed crypto’s user growth at roughly double the internet’s at a comparable stage and argued that tokens uniquely allow investors to own the infrastructure layer of the next web. On total addressable value, he applied the same log-trend framing to the entire digital asset market, sketching a path from roughly $4 trillion today toward a potential $100 trillion by the early 2030s if the space tracks its “fair value” adoption channel, with Bitcoin ultimately occupying a role analogous to gold inside a much larger digital asset stack. Pal closed with operational advice consistent with a longer, liquidity-driven expansion: maintain exposure to proven, large-cap crypto networks, avoid leverage that forces capitulation during routine 20–30% drawdowns, and match time horizon to the macro clock rather than headlines. “We’re four percent of the way there,” he said. “Your job is to not mess this up.” At press time, the total crypto market cap stood at $3.67 trillion. Featured image created with DALL.E, chart from TradingView.com

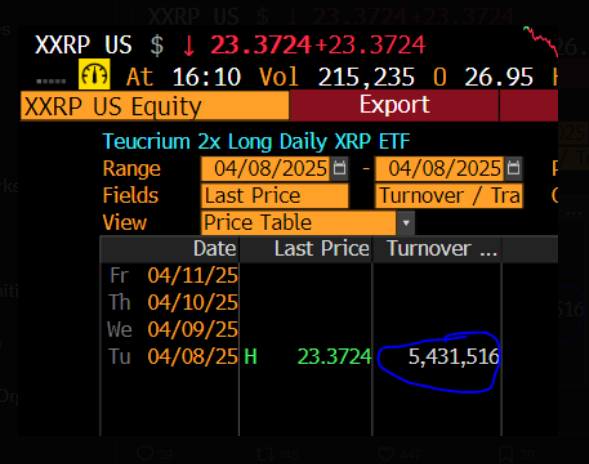 Teucrium’s newly launched 2x XRP ETF on the New York Stocks Exchange recorded $5.43 million in turnover during its first day of trading on April 8, despite XRP prices hitting a five-month low. The ETF, trading under the ticker XXRP, achieved this milestone as cryptocurrency markets faced widespread selling pressure. Bloomberg Senior ETF Analyst Eric Balchunas called the performance “very respectable” given the current bearish market conditions. Related Reading: XRP Will Explode—And This Korean Expert Says He’ll Be ‘Laughing’ At Critics XRP Price Hits Five-Month Low As New ETF Launches According to market data, XRP’s price dropped to $1.61 on Monday, marking its lowest point in five months. The price briefly recovered to over $1.87 on Tuesday before falling again to $1.69 by evening. Even with these unstable price movements, Teucrium moved forward with its ETF launch, aiming to give investors a way to profit from price swings in either direction. $XXRP (2x XRP ETF) saw $5mil in volume on Day One, very respectable, esp considering the mkt conditions. That puts it in approx top 5% of new ETF launches, and about 4x what the 2x Solana ETF $SOLT did (altho both 200x less than King IBIT). pic.twitter.com/u3QQq5yuHv — Eric Balchunas (@EricBalchunas) April 8, 2025 New XRP ETF Outperforms Similar Solana Product Based on reports from Bloomberg’s Balchunas, the XXRP ETF’s first-day trading volume was about four times higher than what Solana’s similar 2x ETF saw on its launch day. This performance puts Teucrium’s product in the top 5% of all new ETF launches. However, the $5.43 million figure still pales in comparison to BlackRock’s Bitcoin ETF debut, which saw trading volume roughly 200 times larger. Community Shows Interest Despite Broad Market Losses The altcoin community has responded positively to the ETF launch, especially considering the harsh market conditions. Data shows that 137,000 traders faced liquidations in the 24 hours surrounding the launch, with total losses exceeding $413 million across cryptocurrency markets. Some XRP supporters have suggested that while XXRP’s volume was much smaller than BlackRock’s Bitcoin ETF (IBIT), a potential spot ETF (which some have dubbed “IXRP”) could provide stronger competition. How The 2x XRP ETF Works And Its Risks Unlike spot ETFs that directly hold the underlying asset, Teucrium’s XXRP does not invest directly in XRP tokens. Instead, it’s designed to deliver twice the daily performance of XRP’s price movements, which amplifies both gains and losses for investors. Related Reading: XRP Dump? Not So Fast—Software Engineer Says Panic Selling Makes No Sense Community figure Crypto Eri warned about the ETF’s built-in risk factors, noting that even if XRP’s price stays flat, volatility alone could cause significant losses. For example, if XRP experiences 25% volatility, XXRP holders could see a 6% loss. With 70% volatility, those losses could balloon to 40%. The launch comes as more than 10 asset managers have filed applications with the SEC for spot XRP ETFs. Major firms like Grayscale and Franklin Templeton have submitted applications, though BlackRock has not yet expressed interest in launching an XRP-specific ETF product. Featured image from Unsplash, chart from TradingView