Lessons From The Longest-Living Among Us
Lessons From The Longest-Living Among Us
 (emphasis ours),
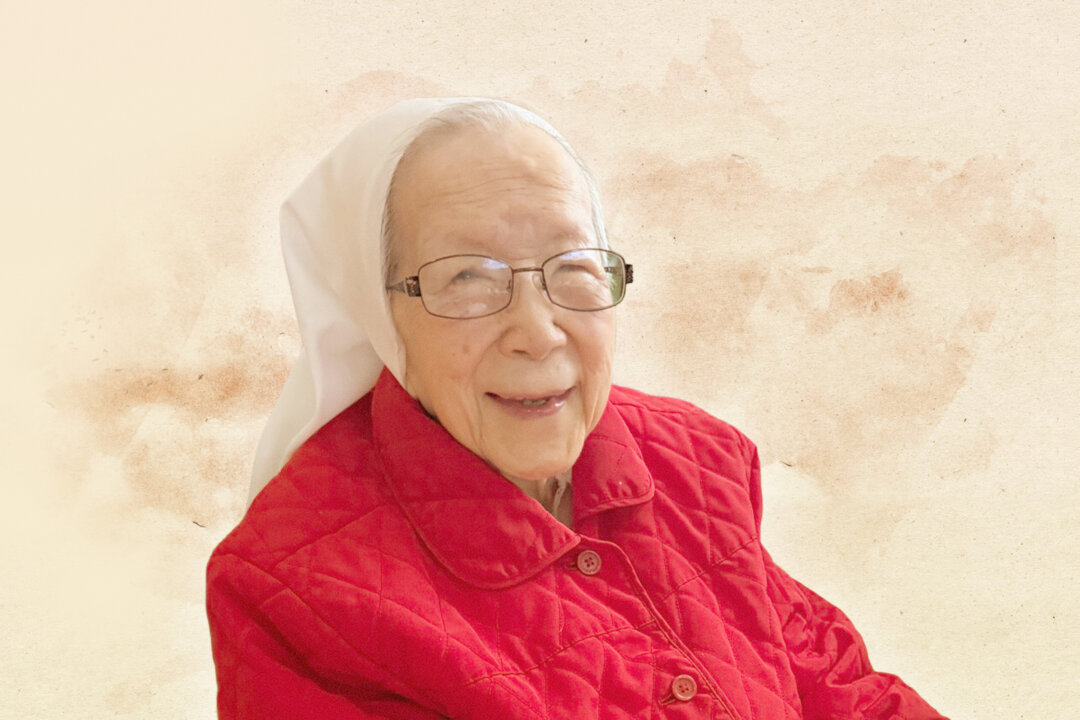
Sister Pacis Bao spent 31 years longing for revenge against the communists who murdered her family—then made a decision at age 79 that may have added 25 years to her life. The 104-year-old nun turned from hatred to forgiveness, which put her mind and body at ease.
(emphasis ours),
Sister Pacis Bao spent 31 years longing for revenge against the communists who murdered her family—then made a decision at age 79 that may have added 25 years to her life. The 104-year-old nun turned from hatred to forgiveness, which put her mind and body at ease.
 Bao is thriving as part of the fastest-growing demographic worldwide: centenarians—people who live past 100.
Life expectancy is generally on the rise, with one in six people worldwide age 60 and over—a rate expected to double by 2050, according to the World Health Organization. Among older adults, those who reach 80 and whose cognitive and physical abilities exceed typical age-related decline are called “superagers.”
Sue Wright, a 98-year-old Midwestern woman with little in common with Bao, is also thriving as a superager.
The two women are quietly practicing the very insight researchers are racing to understand—what helps humans thrive beyond 100.
Aim for Goldilocks Sleep
Both women maintain consistent sleep schedules. Bao goes to sleep by 8 p.m. every night, wakes at 5 a.m., and rests every afternoon—a rhythm that reflects best-practice data and her own needs. Wright follows a similar pattern.
Their routines reflect what researchers call “Goldilocks sleep”—not too much, not too little, and of good quality.
Sleeping less than seven hours a night has been associated with a 14 percent increased risk of all-cause mortality, according to a
published in GeroScience.
The biological effects are significant: chronic low-grade inflammation, impaired immune function, hormonal imbalances, increased blood pressure, and reduced clearance of proteins linked to Alzheimer’s disease.
“While this study focused on sleep duration, sleep quality is another critical factor influencing mortality risk,” the authors wrote. They added that poor sleep—marked by frequent wake-ups and restless nights—has been linked to heart problems, memory decline, and other brain disorders.
Maintain a Healthy Weight
Bao has never been overweight, though she indulges in potstickers and egg rolls on occasion, and enjoys a few bites of ice cream after dinner. Wright, who weighs 119 pounds now, never weighed more than 130 pounds outside of her two pregnancies.
Being overweight or obese is associated with all causes of mortality, even among those who never smoked or had chronic disease, according to a https://www.thelancet.com/article/S0140-6736(16)30175-1/fulltext
published in JAMA found that people who gained more than 66 pounds between early and middle adulthood had higher rates of heart disease, Type 2 diabetes, and obesity-related cancer.
The authors noted that while people and their doctors often dismiss excess weight gain in midlife, it has serious longevity implications.
A https://journals.lww.com/md-journal/fulltext/2019/10180/the_association_between_weight_fluctuation_and.32.aspx
of 15 studies published in Medicine found that weight fluctuations elevate the risk of all-cause mortality, lending credibility to the scale as a way to monitor and maintain a healthy weight.
Flex Your Brain
Just as weight can begin causing problems before the golden years, so can issues like memory, attention, and perception.
“Longitudinal studies have shown that midlife is a critical period for the beginning of the pathology of cognitive disorders,” wrote the authors of a .
on successful aging published in Acta Biomedica. They noted that frequent use of memory and attention, as well as challenging the brain in other ways, may explain why some older people experience higher cognitive functioning.
Those who enjoy a range of brain-stimulating activities—reading, writing, and playing games—across their lifetimes may prevent the onset and progression of Alzheimer’s disease, a leading cause of death worldwide, according to a https://jamanetwork.com/journals/jamaneurology/fullarticle/1149704?utm_source
published in JAMA Neurology.
Both Bao and Wright have kept active schedules, even after stopping 9-to-5 work, and keeping busy hands. They read, play games, and help others in need.
They also both surround themselves with a positive social circle—another factor that can protect the brain. A
Bao is thriving as part of the fastest-growing demographic worldwide: centenarians—people who live past 100.
Life expectancy is generally on the rise, with one in six people worldwide age 60 and over—a rate expected to double by 2050, according to the World Health Organization. Among older adults, those who reach 80 and whose cognitive and physical abilities exceed typical age-related decline are called “superagers.”
Sue Wright, a 98-year-old Midwestern woman with little in common with Bao, is also thriving as a superager.
The two women are quietly practicing the very insight researchers are racing to understand—what helps humans thrive beyond 100.
Aim for Goldilocks Sleep
Both women maintain consistent sleep schedules. Bao goes to sleep by 8 p.m. every night, wakes at 5 a.m., and rests every afternoon—a rhythm that reflects best-practice data and her own needs. Wright follows a similar pattern.
Their routines reflect what researchers call “Goldilocks sleep”—not too much, not too little, and of good quality.
Sleeping less than seven hours a night has been associated with a 14 percent increased risk of all-cause mortality, according to a
published in GeroScience.
The biological effects are significant: chronic low-grade inflammation, impaired immune function, hormonal imbalances, increased blood pressure, and reduced clearance of proteins linked to Alzheimer’s disease.
“While this study focused on sleep duration, sleep quality is another critical factor influencing mortality risk,” the authors wrote. They added that poor sleep—marked by frequent wake-ups and restless nights—has been linked to heart problems, memory decline, and other brain disorders.
Maintain a Healthy Weight
Bao has never been overweight, though she indulges in potstickers and egg rolls on occasion, and enjoys a few bites of ice cream after dinner. Wright, who weighs 119 pounds now, never weighed more than 130 pounds outside of her two pregnancies.
Being overweight or obese is associated with all causes of mortality, even among those who never smoked or had chronic disease, according to a https://www.thelancet.com/article/S0140-6736(16)30175-1/fulltext
published in JAMA found that people who gained more than 66 pounds between early and middle adulthood had higher rates of heart disease, Type 2 diabetes, and obesity-related cancer.
The authors noted that while people and their doctors often dismiss excess weight gain in midlife, it has serious longevity implications.
A https://journals.lww.com/md-journal/fulltext/2019/10180/the_association_between_weight_fluctuation_and.32.aspx
of 15 studies published in Medicine found that weight fluctuations elevate the risk of all-cause mortality, lending credibility to the scale as a way to monitor and maintain a healthy weight.
Flex Your Brain
Just as weight can begin causing problems before the golden years, so can issues like memory, attention, and perception.
“Longitudinal studies have shown that midlife is a critical period for the beginning of the pathology of cognitive disorders,” wrote the authors of a .
on successful aging published in Acta Biomedica. They noted that frequent use of memory and attention, as well as challenging the brain in other ways, may explain why some older people experience higher cognitive functioning.
Those who enjoy a range of brain-stimulating activities—reading, writing, and playing games—across their lifetimes may prevent the onset and progression of Alzheimer’s disease, a leading cause of death worldwide, according to a https://jamanetwork.com/journals/jamaneurology/fullarticle/1149704?utm_source
published in JAMA Neurology.
Both Bao and Wright have kept active schedules, even after stopping 9-to-5 work, and keeping busy hands. They read, play games, and help others in need.
They also both surround themselves with a positive social circle—another factor that can protect the brain. A  published in Alzheimer’s Dementia found that those with strong midlife relationships had a lower dementia risk compared to those with poor relationships.
Flex Your Muscles, Too
Centenarians don’t need to lift weights, though retaining muscle mass leads to better heart function, mobility, and balance, and prevents Type 2 diabetes.
An
about the blue zones noted that the world’s longest-living people often move because of necessity, fun, and function. They grow gardens, don’t rely on mechanical conveniences, and accumulate thousands of steps each day without a formal plan or tracking.
Wright grew up playing basketball and baseball with her brothers, golfed regularly as an adult, and was even spotted dancing without her walker at the assisted living home where she moved a year ago after a COVID-19 infection left her with leg weakness.
“We used to go dancing all the time—went every weekend,” she said, smiling at the memory.
Fill Your Calendar
Wright’s dancing came with a lot of socializing—another hallmark of longevity. A robust social life ranked right behind good health when surveyed adults described what successful aging means to them. The https://academic.oup.com/gerontologist/article/55/1/91/574083
were reported in The Gerontologist
The adults pointed to having friends and family, feeling supported, not being lonely, participating in social activities, and being involved with younger generations.
While Wright misses her neighborhood friends, she is enjoying regular company and staying active in her assisted living community. “I like everyone here. It’s nice to be around people you can visit with,” she said. “I do like to help others when they need help, too.”
Wright will soon be moving to a new state to be close to her son and other family. Her nieces are already planning a party for her 100th birthday.
Don’t Dwell on Your Age
Aging isn’t just an ongoing celebration. Wright has outlived two husbands and all of her friends, and suffered through the loss of a son when he was age 3.
“You think a lot about it and wonder why, but you have to accept losses and go on with life,” she said. “You just have to cope with it and try not to think about it, because we all have to go.”
Accepting aging and dying are important to living a fulfilled life, according to about one-quarter of participants in the successful aging survey. While many said reaching 80 and beyond was a lofty goal, some noted it’s important not to wish to be young again or to view aging as a punishment.
Take It Easy
Overthinking aging—or anything, for that matter—increases stress, and stress is linked to numerous diseases. The solution: regularly find a way to relax both emotionally and physically.
Although everyone experiences stress, the world’s longest-lived people have routines to shed that stress, wrote Dan Buettner and Sam Skemp, authors of the blue zones article. “Okinawans take a few moments each day to remember their ancestors; Adventists pray; Ikarians take a nap; and Sardinians do happy hour.”
In addition to praying, Bao draws and paints hummingbirds and flowers. Her hand isn’t as steady as it used to be, but that doesn’t matter. Not only does it improve her mood to make them, but it also delights her to give away her creations.
“Sometimes the people, they need cheer,” she said, adding that she likes to bless the staff at the convent. “They take good care of us, and we are sure grateful.”
Disease Can’t Always Be Avoided
Aging trends have spurred interest and research in centenarians—often considered models of aging well because they’ve managed to delay disease. Within the demographic, however, some are long-suffering with disease, while others seem to avoid disease altogether.
Researchers categorize centenarians as:
Escapers: About 15 percent who show no sign of disease at age 100.
Survivors: About 42 percent who had disease before reaching age 80.
Delayers: About 43 percent who had no age-related diseases until reaching age 80 or beyond.
Wright has kidney disease and struggles to drink enough water. She’s lost some weight and said that while she'd like to live to 100, she doesn’t plan to undergo dialysis treatments if her condition advances.
Bao moved from the independent wing of her convent to be near the nurse’s station two years ago—but not because she’s ill. The oldest resident, Bao figured it only made sense, though a convent administrator said she’s the healthiest of the residents.
Despite the rapid increase in centenarians, reaching 100 remains rare. There are about 2.6 per 10,000 people in the United States, up from 2.1 in 2020 and 1.42 in 1980.
“Day by day, Jesus is always the same to me, giving me extra help,” Bao said.
“I say to myself every day when I get up, ‘I’m grateful, and today’s going to be a good day.’”
Fri, 11/07/2025 - 22:35
published in Alzheimer’s Dementia found that those with strong midlife relationships had a lower dementia risk compared to those with poor relationships.
Flex Your Muscles, Too
Centenarians don’t need to lift weights, though retaining muscle mass leads to better heart function, mobility, and balance, and prevents Type 2 diabetes.
An
about the blue zones noted that the world’s longest-living people often move because of necessity, fun, and function. They grow gardens, don’t rely on mechanical conveniences, and accumulate thousands of steps each day without a formal plan or tracking.
Wright grew up playing basketball and baseball with her brothers, golfed regularly as an adult, and was even spotted dancing without her walker at the assisted living home where she moved a year ago after a COVID-19 infection left her with leg weakness.
“We used to go dancing all the time—went every weekend,” she said, smiling at the memory.
Fill Your Calendar
Wright’s dancing came with a lot of socializing—another hallmark of longevity. A robust social life ranked right behind good health when surveyed adults described what successful aging means to them. The https://academic.oup.com/gerontologist/article/55/1/91/574083
were reported in The Gerontologist
The adults pointed to having friends and family, feeling supported, not being lonely, participating in social activities, and being involved with younger generations.
While Wright misses her neighborhood friends, she is enjoying regular company and staying active in her assisted living community. “I like everyone here. It’s nice to be around people you can visit with,” she said. “I do like to help others when they need help, too.”
Wright will soon be moving to a new state to be close to her son and other family. Her nieces are already planning a party for her 100th birthday.
Don’t Dwell on Your Age
Aging isn’t just an ongoing celebration. Wright has outlived two husbands and all of her friends, and suffered through the loss of a son when he was age 3.
“You think a lot about it and wonder why, but you have to accept losses and go on with life,” she said. “You just have to cope with it and try not to think about it, because we all have to go.”
Accepting aging and dying are important to living a fulfilled life, according to about one-quarter of participants in the successful aging survey. While many said reaching 80 and beyond was a lofty goal, some noted it’s important not to wish to be young again or to view aging as a punishment.
Take It Easy
Overthinking aging—or anything, for that matter—increases stress, and stress is linked to numerous diseases. The solution: regularly find a way to relax both emotionally and physically.
Although everyone experiences stress, the world’s longest-lived people have routines to shed that stress, wrote Dan Buettner and Sam Skemp, authors of the blue zones article. “Okinawans take a few moments each day to remember their ancestors; Adventists pray; Ikarians take a nap; and Sardinians do happy hour.”
In addition to praying, Bao draws and paints hummingbirds and flowers. Her hand isn’t as steady as it used to be, but that doesn’t matter. Not only does it improve her mood to make them, but it also delights her to give away her creations.
“Sometimes the people, they need cheer,” she said, adding that she likes to bless the staff at the convent. “They take good care of us, and we are sure grateful.”
Disease Can’t Always Be Avoided
Aging trends have spurred interest and research in centenarians—often considered models of aging well because they’ve managed to delay disease. Within the demographic, however, some are long-suffering with disease, while others seem to avoid disease altogether.
Researchers categorize centenarians as:
Escapers: About 15 percent who show no sign of disease at age 100.
Survivors: About 42 percent who had disease before reaching age 80.
Delayers: About 43 percent who had no age-related diseases until reaching age 80 or beyond.
Wright has kidney disease and struggles to drink enough water. She’s lost some weight and said that while she'd like to live to 100, she doesn’t plan to undergo dialysis treatments if her condition advances.
Bao moved from the independent wing of her convent to be near the nurse’s station two years ago—but not because she’s ill. The oldest resident, Bao figured it only made sense, though a convent administrator said she’s the healthiest of the residents.
Despite the rapid increase in centenarians, reaching 100 remains rare. There are about 2.6 per 10,000 people in the United States, up from 2.1 in 2020 and 1.42 in 1980.
“Day by day, Jesus is always the same to me, giving me extra help,” Bao said.
“I say to myself every day when I get up, ‘I’m grateful, and today’s going to be a good day.’”
Fri, 11/07/2025 - 22:35
The Epoch Times
9 Lessons From the Longest-Living Among Us
A 104-year-old nun and a 98-year-old woman reveal longevity secrets backed by research.
Bao is thriving as part of the fastest-growing demographic worldwide: centenarians—people who live past 100.
Life expectancy is generally on the rise, with one in six people worldwide age 60 and over—a rate expected to double by 2050, according to the World Health Organization. Among older adults, those who reach 80 and whose cognitive and physical abilities exceed typical age-related decline are called “superagers.”
Sue Wright, a 98-year-old Midwestern woman with little in common with Bao, is also thriving as a superager.
The two women are quietly practicing the very insight researchers are racing to understand—what helps humans thrive beyond 100.
Aim for Goldilocks Sleep
Both women maintain consistent sleep schedules. Bao goes to sleep by 8 p.m. every night, wakes at 5 a.m., and rests every afternoon—a rhythm that reflects best-practice data and her own needs. Wright follows a similar pattern.
Their routines reflect what researchers call “Goldilocks sleep”—not too much, not too little, and of good quality.
Sleeping less than seven hours a night has been associated with a 14 percent increased risk of all-cause mortality, according to a Imbalanced sleep increases mortality risk by 14–34%: a meta-analysis | GeroScience
Sleep duration is a crucial factor influencing health outcomes, yet its relationship with mortality remains debated. In this meta-analysis, we aime...
Definitions of successful ageing: A brief review of a multidimensional concept - PMC
Successful ageing has become an important concept to describe the quality of ageing. It is a multidimensional concept, and the main focus is how to...
PubMed
Associations between mid-life social relationships and the risk of incident dementia: The ARIC study - PubMed
Psychosocial health is a modifiable risk factor for dementia. Stronger mid-life social relationships are associated with a lower risk of dementia. ...
Blue Zones: Lessons From the World’s Longest Lived - PMC
What began as a National Geographic expedition, lead by Dan Buettner, to uncover the secrets of longevity, evolved into the discovery of the 5 plac...
Tyler Durden | Zero Hedge
Zero Hedge
Lessons From The Longest-Living Among Us | ZeroHedge
ZeroHedge - On a long enough timeline, the survival rate for everyone drops to zero
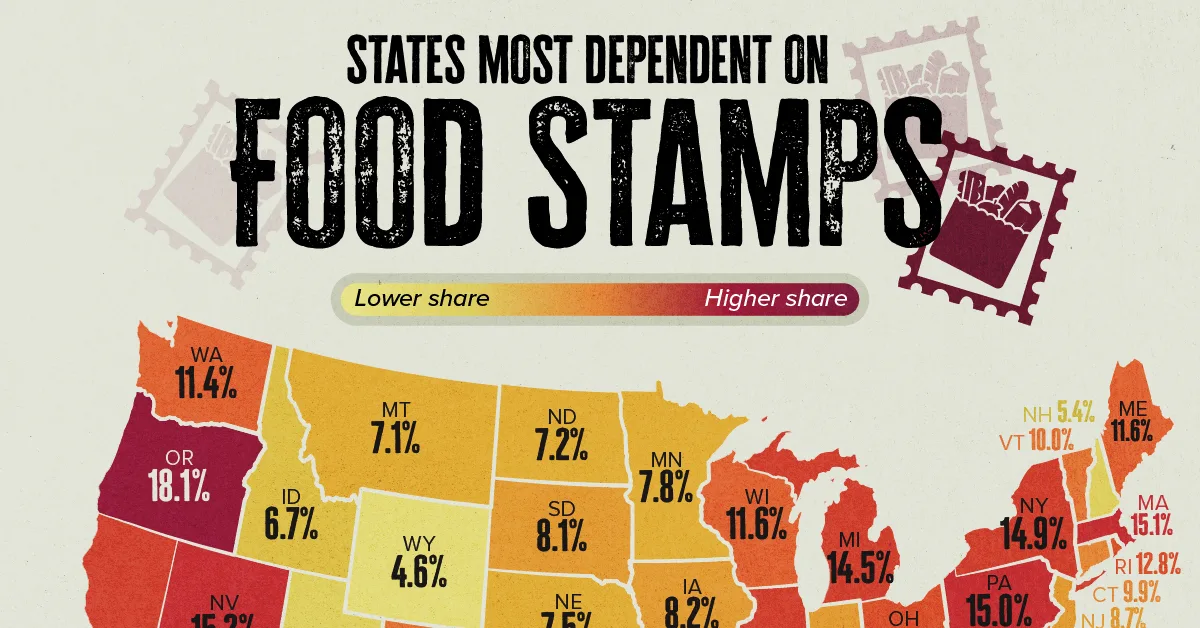
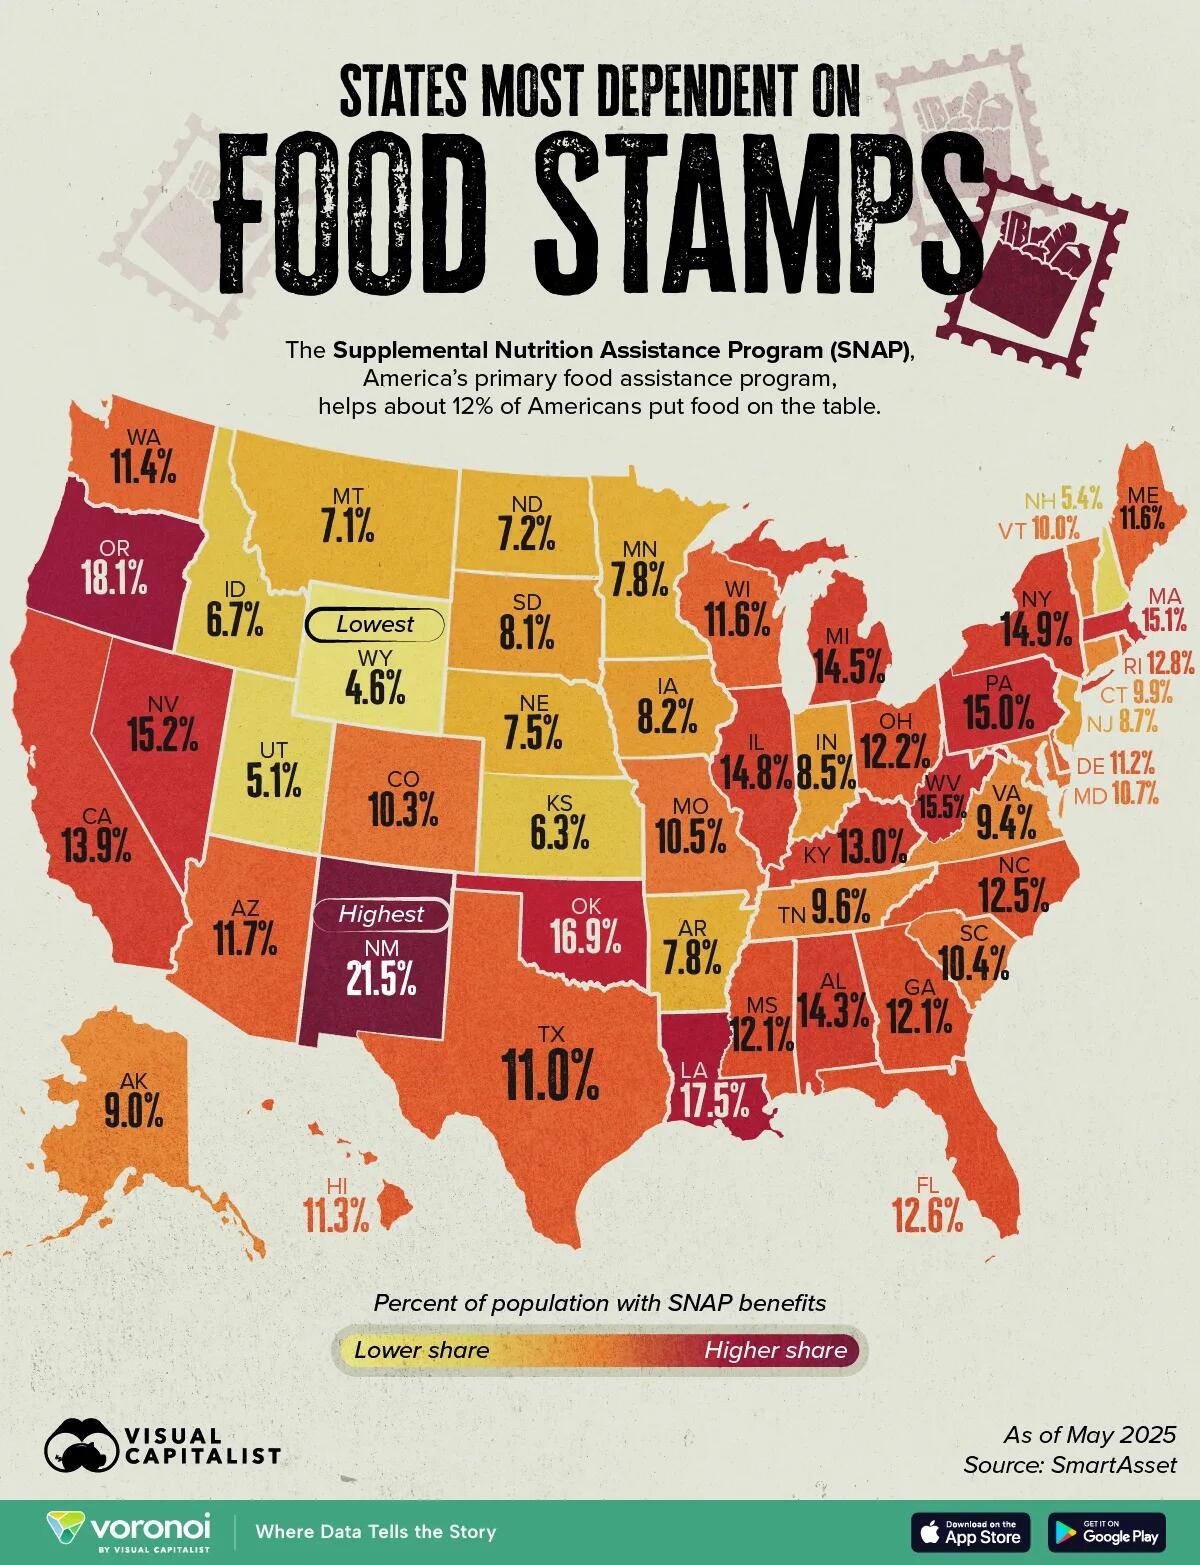 New Mexico Leads in SNAP Dependence
New Mexico stands out as the most SNAP-dependent state, with 21.5% of residents receiving assistance, nearly double the national average. The average monthly benefit there is $176.51 per person, totaling over $80 million in monthly aid. Persistent poverty rates and rural isolation help explain the state’s high reliance on federal food assistance.
Oregon follows closely at 18.1% enrollment, while Louisiana ranks third at 17.5%. In each case, elevated unemployment and cost pressures have contributed to continued demand for benefits.
Coastal and Urban States See Higher Benefit Amounts
States like New York ($218.44), Massachusetts ($215.64), and Hawaii ($361.78) report some of the highest average benefits per person. These higher payments reflect steeper living costs in dense urban and island economies.
Rank
State
Population with SNAP
Avg benefit per person
Number of beneficiaries
Total monthly benefits
1
New Mexico
21.5%
$176.51
457,699
$80,790,060
2
Oregon
18.1%
$182.17
772,893
$140,797,421
3
Louisiana
17.5%
$186.90
803,988
$150,268,544
4
Oklahoma
16.9%
$186.85
692,477
$129,386,266
5
W. Virginia
15.5%
$167.74
273,566
$45,886,908
6
Nevada
15.2%
$171.80
496,848
$85,360,880
7
Massachusetts
15.1%
$215.64
1,076,187
$232,066,810
8
Pennsylvania
15.0%
$181.70
1,958,047
$355,777,154
9
New York
14.9%
$218.44
2,962,913
$647,210,404
10
Illinois
14.8%
$195.94
1,879,564
$368,278,250
11
Michigan
14.5%
$175.44
1,473,832
$258,575,524
12
Alabama
14.3%
$193.08
736,178
$142,142,795
13
California
13.9%
$190.25
5,494,318
$1,045,310,679
14
Kentucky
13.0%
$178.94
595,155
$106,498,834
15
Rhode Island
12.8%
$200.95
142,726
$28,680,737
16
Florida
12.6%
$181.97
2,943,012
$535,551,777
17
North Carolina
12.5%
$174.75
1,378,291
$240,858,724
18
Ohio
12.2%
$186.03
1,450,955
$269,917,495
19
Georgia
12.1%
$186.08
1,356,493
$252,417,633
20
Mississippi
12.1%
$180.46
357,042
$64,432,174
21
Arizona
11.7%
$182.25
887,253
$161,705,602
22
Maine
11.6%
$176.55
163,520
$28,869,975
23
Wisconsin
11.6%
$163.89
689,315
$112,973,934
24
Washington
11.4%
$184.51
905,471
$167,068,578
25
Hawaii
11.3%
$361.78
163,576
$59,178,123
26
Delaware
11.2%
$180.54
118,209
$21,340,950
27
Texas
11.0%
$177.82
3,455,085
$614,386,464
28
Maryland
10.7%
$182.49
667,981
$121,902,010
29
Missouri
10.5%
$196.10
655,940
$128,629,589
30
South Carolina
10.4%
$186.42
567,895
$105,867,349
31
Colorado
10.3%
$195.97
614,843
$120,493,408
32
Vermont
10.0%
$188.75
64,633
$12,199,424
33
Connecticut
9.9%
$192.89
363,524
$70,118,853
34
Tennessee
9.6%
$203.20
690,545
$140,318,213
35
Virginia
9.4%
$173.84
824,866
$143,392,688
36
Alaska
9.0%
$364.31
66,377
$24,181,479
37
New Jersey
8.7%
$194.63
826,094
$160,778,766
38
Indiana
8.5%
$195.71
586,403
$114,763,019
39
Iowa
8.2%
$169.04
267,158
$45,159,537
40
South Dakota
8.1%
$198.24
75,282
$14,923,544
41
Minnesota
7.8%
$158.45
451,966
$71,616,027
42
Arkansas
7.8%
$172.82
239,748
$41,434,391
43
Nebraska
7.5%
$181.00
150,600
$27,258,920
44
North Dakota
7.2%
$174.33
57,129
$9,959,141
45
Montana
7.1%
$170.68
80,523
$13,743,731
46
Idaho
6.7%
$179.01
133,545
$23,906,189
47
Kansas
6.3%
$177.23
186,036
$32,971,957
48
New Hampshire
5.4%
$169.56
75,717
$12,838,748
49
Utah
5.1%
$192.17
177,087
$34,030,139
50
Wyoming
4.6%
$183.81
27,122
$4,985,385
In contrast, benefits tend to be smaller in lower-cost Midwestern states such as Wisconsin ($163.89) and Minnesota ($158.45), where overall food prices and housing costs are lower.
Low Participation in Western States
Wyoming has the lowest SNAP participation rate at just 4.6%, followed by Utah (5.1%) and New Hampshire (5.4%). Still, even in these states, food stamps remains a crucial safety net for tens of thousands of residents. Utah alone distributes more than $34 million in benefits each month to about 177,000 people.
If you enjoyed today’s post, check out
New Mexico Leads in SNAP Dependence
New Mexico stands out as the most SNAP-dependent state, with 21.5% of residents receiving assistance, nearly double the national average. The average monthly benefit there is $176.51 per person, totaling over $80 million in monthly aid. Persistent poverty rates and rural isolation help explain the state’s high reliance on federal food assistance.
Oregon follows closely at 18.1% enrollment, while Louisiana ranks third at 17.5%. In each case, elevated unemployment and cost pressures have contributed to continued demand for benefits.
Coastal and Urban States See Higher Benefit Amounts
States like New York ($218.44), Massachusetts ($215.64), and Hawaii ($361.78) report some of the highest average benefits per person. These higher payments reflect steeper living costs in dense urban and island economies.
Rank
State
Population with SNAP
Avg benefit per person
Number of beneficiaries
Total monthly benefits
1
New Mexico
21.5%
$176.51
457,699
$80,790,060
2
Oregon
18.1%
$182.17
772,893
$140,797,421
3
Louisiana
17.5%
$186.90
803,988
$150,268,544
4
Oklahoma
16.9%
$186.85
692,477
$129,386,266
5
W. Virginia
15.5%
$167.74
273,566
$45,886,908
6
Nevada
15.2%
$171.80
496,848
$85,360,880
7
Massachusetts
15.1%
$215.64
1,076,187
$232,066,810
8
Pennsylvania
15.0%
$181.70
1,958,047
$355,777,154
9
New York
14.9%
$218.44
2,962,913
$647,210,404
10
Illinois
14.8%
$195.94
1,879,564
$368,278,250
11
Michigan
14.5%
$175.44
1,473,832
$258,575,524
12
Alabama
14.3%
$193.08
736,178
$142,142,795
13
California
13.9%
$190.25
5,494,318
$1,045,310,679
14
Kentucky
13.0%
$178.94
595,155
$106,498,834
15
Rhode Island
12.8%
$200.95
142,726
$28,680,737
16
Florida
12.6%
$181.97
2,943,012
$535,551,777
17
North Carolina
12.5%
$174.75
1,378,291
$240,858,724
18
Ohio
12.2%
$186.03
1,450,955
$269,917,495
19
Georgia
12.1%
$186.08
1,356,493
$252,417,633
20
Mississippi
12.1%
$180.46
357,042
$64,432,174
21
Arizona
11.7%
$182.25
887,253
$161,705,602
22
Maine
11.6%
$176.55
163,520
$28,869,975
23
Wisconsin
11.6%
$163.89
689,315
$112,973,934
24
Washington
11.4%
$184.51
905,471
$167,068,578
25
Hawaii
11.3%
$361.78
163,576
$59,178,123
26
Delaware
11.2%
$180.54
118,209
$21,340,950
27
Texas
11.0%
$177.82
3,455,085
$614,386,464
28
Maryland
10.7%
$182.49
667,981
$121,902,010
29
Missouri
10.5%
$196.10
655,940
$128,629,589
30
South Carolina
10.4%
$186.42
567,895
$105,867,349
31
Colorado
10.3%
$195.97
614,843
$120,493,408
32
Vermont
10.0%
$188.75
64,633
$12,199,424
33
Connecticut
9.9%
$192.89
363,524
$70,118,853
34
Tennessee
9.6%
$203.20
690,545
$140,318,213
35
Virginia
9.4%
$173.84
824,866
$143,392,688
36
Alaska
9.0%
$364.31
66,377
$24,181,479
37
New Jersey
8.7%
$194.63
826,094
$160,778,766
38
Indiana
8.5%
$195.71
586,403
$114,763,019
39
Iowa
8.2%
$169.04
267,158
$45,159,537
40
South Dakota
8.1%
$198.24
75,282
$14,923,544
41
Minnesota
7.8%
$158.45
451,966
$71,616,027
42
Arkansas
7.8%
$172.82
239,748
$41,434,391
43
Nebraska
7.5%
$181.00
150,600
$27,258,920
44
North Dakota
7.2%
$174.33
57,129
$9,959,141
45
Montana
7.1%
$170.68
80,523
$13,743,731
46
Idaho
6.7%
$179.01
133,545
$23,906,189
47
Kansas
6.3%
$177.23
186,036
$32,971,957
48
New Hampshire
5.4%
$169.56
75,717
$12,838,748
49
Utah
5.1%
$192.17
177,087
$34,030,139
50
Wyoming
4.6%
$183.81
27,122
$4,985,385
In contrast, benefits tend to be smaller in lower-cost Midwestern states such as Wisconsin ($163.89) and Minnesota ($158.45), where overall food prices and housing costs are lower.
Low Participation in Western States
Wyoming has the lowest SNAP participation rate at just 4.6%, followed by Utah (5.1%) and New Hampshire (5.4%). Still, even in these states, food stamps remains a crucial safety net for tens of thousands of residents. Utah alone distributes more than $34 million in benefits each month to about 177,000 people.
If you enjoyed today’s post, check out 

 Both sides went through multiple rounds of escalation and de-escalation. Last month, they


 As shown in Statista’s recent findings, 43 percent of respondents said they regularly work in their company's office, while 16 percent reported working primarily in factories or production facilities.

 The report received wide attention as it resonated with myriad data points – including declining marriage and birth rates and the rise of remote work – showing Americans are spending less face time with one another. But a RealClearInvestigations inquiry has found that its warnings of a loneliness epidemic are unsupported and that its claims of severe health risks stem from a misreading of the data.
The University of Rochester’s Viji Kannan, whom Murthy partly relied on for his claims of a loneliness increase, told RCI her study focused on measurable declines in social connections and not more subjective feelings of loneliness. “YES!” she said in an email. “Loneliness is a different thing.”
Daniel Cox at the American Enterprise Institute, whose research on loneliness was also cited by the surgeon general, had a similar take. He told RCI, “The evidence more strongly supports an epidemic of ‘aloneness’ rather than loneliness. We are spending more time by ourselves.”
Hans IJzerman, who studies loneliness at the University of Oxford, concurred. “The biggest story may be how the surgeon general basically butchered the narrative by not relying on solid data,” he said.
Murthy, who now works outside of government, did not respond to request for comment. The Department of Health and Human Services, which still posts the loneliness report on its website, declined to comment, citing the government shutdown.
Critics say the former surgeon general’s questionable assertion of a loneliness epidemic –
The report received wide attention as it resonated with myriad data points – including declining marriage and birth rates and the rise of remote work – showing Americans are spending less face time with one another. But a RealClearInvestigations inquiry has found that its warnings of a loneliness epidemic are unsupported and that its claims of severe health risks stem from a misreading of the data.
The University of Rochester’s Viji Kannan, whom Murthy partly relied on for his claims of a loneliness increase, told RCI her study focused on measurable declines in social connections and not more subjective feelings of loneliness. “YES!” she said in an email. “Loneliness is a different thing.”
Daniel Cox at the American Enterprise Institute, whose research on loneliness was also cited by the surgeon general, had a similar take. He told RCI, “The evidence more strongly supports an epidemic of ‘aloneness’ rather than loneliness. We are spending more time by ourselves.”
Hans IJzerman, who studies loneliness at the University of Oxford, concurred. “The biggest story may be how the surgeon general basically butchered the narrative by not relying on solid data,” he said.
Murthy, who now works outside of government, did not respond to request for comment. The Department of Health and Human Services, which still posts the loneliness report on its website, declined to comment, citing the government shutdown.
Critics say the former surgeon general’s questionable assertion of a loneliness epidemic – 

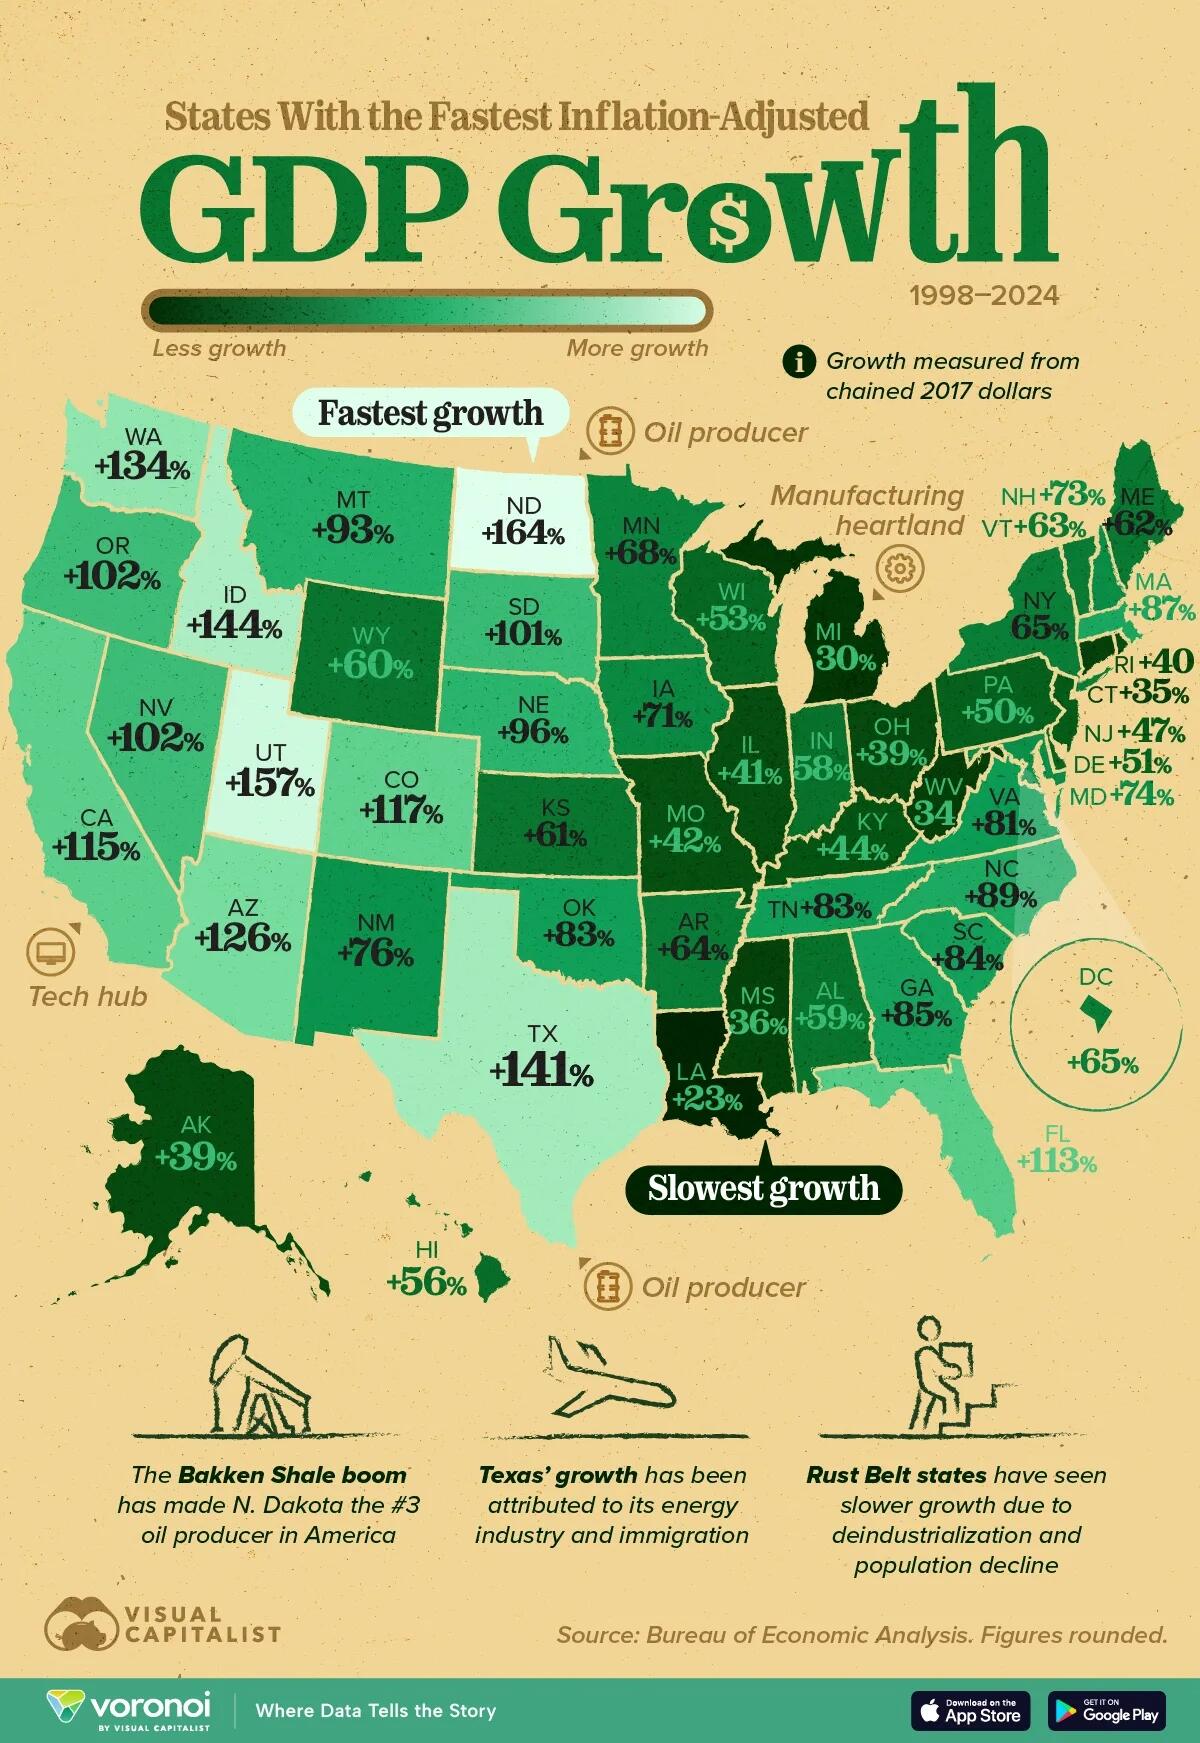 Data for real GDP growth by U.S. state is sourced from
  Last week, major airlines and unions
  The data for this graphic comes from
 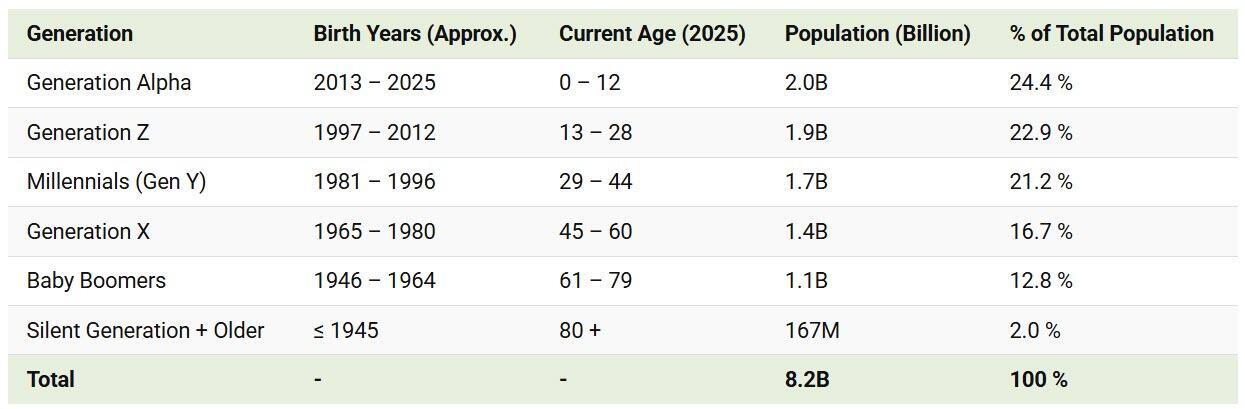 Gen Z and Millennials Dominate the Workforce
Gen Z (ages 13–28) and Millennials (ages 29–44) together account for 44% of all people—and most of the world’s workers. Millennials alone make up 1.7 billion people.
The Aging Populations of Boomers and the Silent Generation
At the upper end of the age spectrum, Baby Boomers (ages 61–79) represent about 12.8% of the population, while those 80 or older—the Silent Generation and older cohorts—make up just 2%.
If you enjoyed today’s post, check out
Gen Z and Millennials Dominate the Workforce
Gen Z (ages 13–28) and Millennials (ages 29–44) together account for 44% of all people—and most of the world’s workers. Millennials alone make up 1.7 billion people.
The Aging Populations of Boomers and the Silent Generation
At the upper end of the age spectrum, Baby Boomers (ages 61–79) represent about 12.8% of the population, while those 80 or older—the Silent Generation and older cohorts—make up just 2%.
If you enjoyed today’s post, check out