#Ether appears to be printing two gravestone dojis in a row on the 2-week candlestick chart. If this pattern is confirmed, a retracement is likely at the start of 2024. The last time a similar pattern formed, #ETH corrected about 15%. image #ETHUSD / #Ethereum / #ETHUSDT / #ERC20
One of the problems of generative #AI is that it's not open-source. Centralized control of AI is a major threat.
Just want to say thank you to all the wonderful people on here who have supported me over the past month! Thank you not just for your support, but also for just being on #Nostr. I appreciate that this platform even exists and that there are so many like-minded, #freedom-loving people.
Posted my first article on #Habla -- check it out!
The 10-year/3-month #Treasury yield spread is about to print a reversal doji on the 6-month chart. Typically recessions (shaded in red) begin when this spread moves substantially higher. Earlier this year, the NY #Fed, using this chart as a recession predictor, placed the odds of a U.S. #recession starting by May 2024 at 70%. This was the strongest recession signal in over 40 years. image See more here:
A massive bearish shooting star is appearing on the quarterly chart of #SPY / #IWM The tail of the shooting star tagged the peak level reached during the Dotcom Bubble (depicted by the black line in the chart). It's likely that this ratio has peaked and is about to roll over. We may be at the start of what will be years of large-cap underperformance relative to small-cap. This does not necessarily mean that the Russell 2000 will rally from here on out, instead it's a warning that the large-cap stocks that comprise the SPY have a lot to lose in the coming recession -- even more than already hard-hit small-cap stocks. #SPX / #RUT / #smallcap / #mag7 image
The #Fed is preparing to pivot back to monetary easing right as #war begins to disrupt global supply chains.image
Decentralized Autonomous Organizations (also known as #DAOs) have immense potential to disrupt Wall Street and the current multinational corporate system. One of the biggest leaps forward will come when the means of production becomes increasingly controlled by DAOs. Wall Street is hardly prepared for a future where control of production is #decentralized. Rather than owning shares in a corporation that can be traded and controlled by #WallStreet, equity ownership of a DAO can be established through asset tokenization, built using smart contract logic, which eliminates the need for Wall Street to serve as a middleman for transactions or as the custodian of assets. Decentralization is already underway, with decentralized #finance protocols like #Uniswap and #AAVE already issuing tokens that in turn allow for decentralized control of their treasuries. Since these frameworks are built, in large part, on the #Ethereum network, #Ether will be increasingly demanded over time as the De-Fi space grows by orders of magnitude over the coming years and decades. Most legal systems do not provide sufficient infrastructure for the formation and existence of DAOs. Thus, inevitably, DAOs will come at odds with centralized governance. Yet, it remains to be seen how decentralized organizations can effectively be stopped. Certainly, #CBDCs will become an important tool.
A good trader is one who trades fiat currency for scarce assets.
Recessions and volatility spikes tend to occur when the SPY/TLT ratio plummets. Right now, the #SPY / #TLT ratio is printing a bearish shooting star all the way up on the quarterly chart (each candlestick is a 3-month period). image 
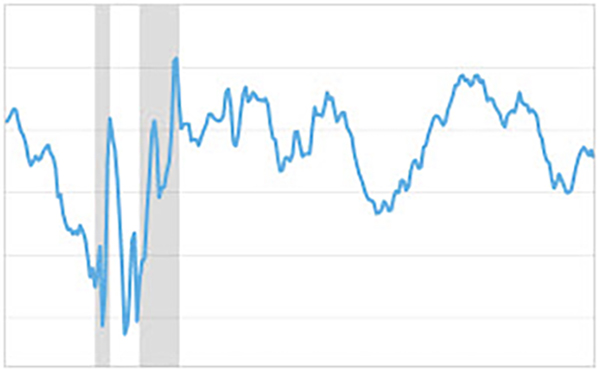
Note how high this ratio has risen. It's nearly double the peak value reached in the lead-up to prior recessions. (The red-shaded areas highlight previous U.S. recessions). Never has the S&P 500 been as overvalued as it is now when compared against the 'risk-free asset' (long-duration U.S. Treasurys). In fact, the S&P 500 is so overvalued that the sell-off in 2022 merely brought the Shiller PE Ratio down to about the same level as the peak before the Great Depression. What concerns me the most about this SPY/TLT ratio chart is the unprecedented confluence of higher timeframe charts. The ratio is about to begin oscillating down on the monthly, quarterly, semi-annual, and yearly charts at the same time. My conclusion is that the coming recession will likely last quite a long time, or that it will come in waves as occurred during the stagflation of the 1970s (when several recessions occurred within the span of about 10 years). Although it's easy to believe the proposition that a soft landing has been achieved when the VIX is 12 and the SPY is near an ATH, be aware that higher volatility will ensue from the record-fast rate hiking cycle. There is always a long lag between when interest rates rise and when the broad economy is impacted. Many charts continue to confirm that strong stagflation is coming. While I am a stock market bull over the long term, I remain convinced that an economic storm is coming.