Maybe you should zoom out.
Pt 6 》So, all in all I’d say no need for panic stations here. Rather, best to hold the course and have some confidence [while remaining hedged] that the process of capitalization aka the LGC curve will continue to perfrom going forward.《 FIN《 {Note: good technical analysis does Not mean rational political analysis. We're all human and have different perspectives. I'd be more comfortable recommending this author if he stuck to the charts.} * source:
Pt.5 》 Also interesting to note is the way in which the LGC channel itself shows how modest, how technical, how non-parabolic the recent few years have been… and accordingly how modest the correction in turn is likely to be. What I think we’re seeing here is a process of price discovery, of capitalization, along the lines of the LGC curve itself. The previous upper range of the channel looks to have belonged to the ‘immaturity’ of parabolic markets - it looks to have become redundant in a market that is becoming less volatile and more stable. For the true Bitcoiner this has to be something of a positive to counter-balance the disappointment of not seeing higher prices here and now. image
Pt.4 》 Here we have the model of the LGC [Logarithmic Growth Curve] overlaid onto the technicals. Interesting to note that the LGC ‘buyzone’ [that has served investors in the past very well] lines up with the technical bottoming range as discribed above. If price were to go deep into the buyzone, that would be the 55K level; if price were to be supported by the ‘buyzone’ [bottom band of the LGC], that would be the 70K odd level. image
Pt.3 
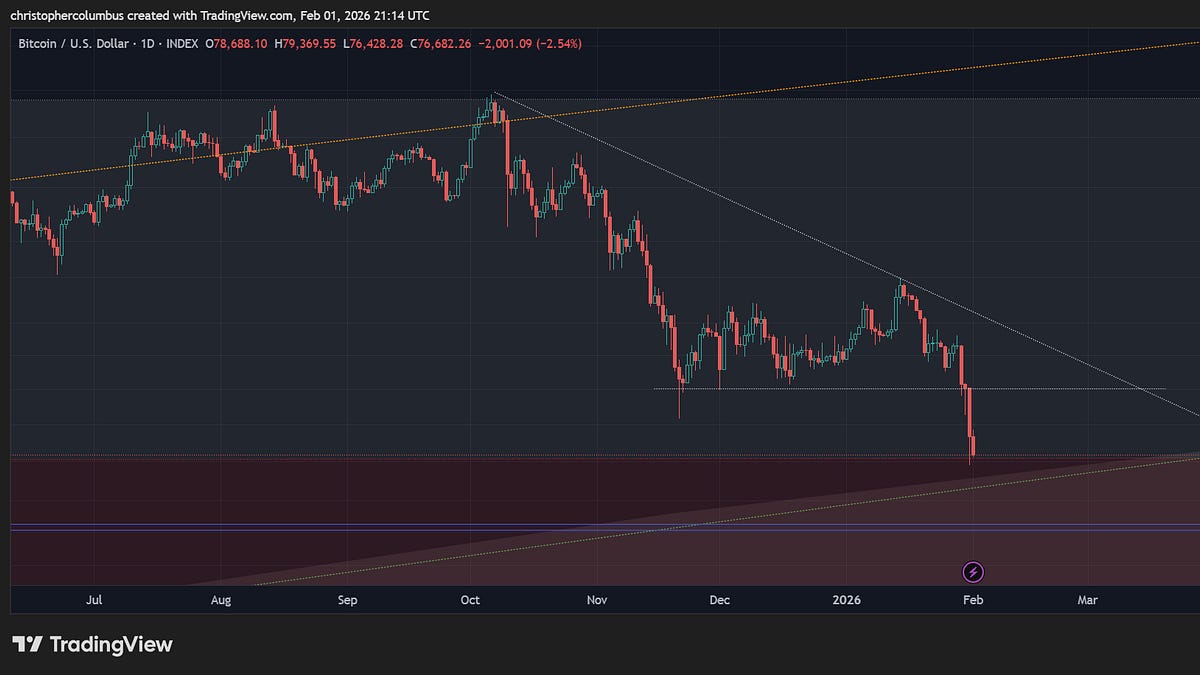
》But, the reader asks, wouldn’t that mean prices back into the 40K range? Though an improvement on the 20K range, I still think that looks too low a prediction, and for technical reasons. What’s interesting about the chart, after a prolonged period of a more technical non-parabolic maturing market, is the extended line of resistance come [possible] support as it appears on the chart at the 70K level. I would mark this as the optimistic bottom of the present correction. Also common in market corrections of large moves that remain in an ongoing bull market is the 2nd fib level of a 38% correction [of the real/ log values]. This would have the correction bottoming out at around a more pessimistic 55K range. With the technicals in mind, with the bottom somewhere between the 70 and 55k range, what can the LGC model say about these levels? Can the modular outlook corroborate the technical one, or is there zero synergy between them?, image
Embrace the pain 📉 🦡 @Furious Honey Badger ⚡️